New Hop Data Reveals Future Trends
A Fresh Perspective on Hop Industry Data Changes the Narrative
INTRODUCTION
My Goal
My goal with this report is to provide a useful original perspective along with some analysis of existing data without replicating the information existing in other reports. My main constraint here is to present a unique analysis of the available data. I’m not in a battle for market share. I have no agenda to portray any industry or company in a positive or negative light. My goal is to report the data in useful way and to add my interpretation of its impact on the industry. I’ve cited my sources and methods so others may produce these analyses in the future. All the data, except for my experiences from over 20 years in the industry, are public. My experiences during that time helped form the opinions I share in the commentaries below. Others with more experience than me could present this type of information if they so choose in the future. I hope they do. More information and perspectives to consider would be better for everybody. The current method of presenting industry data reflects the will and financial interests of those with the strongest influence. From my experience, the main characters in the industry act as if they believe it is more profitable to main an opaque industry while giving lip service to transparency.
I have made these analyses available for free rather than putting them behind a paywall because I would like them to reach more people. I hope you enjoy the unique way I have presented these data and that you find my interpretation of them useful. If you do, I would like to suggest something foreign to the hop industry. Value-for-value is a model where if you find value in content you received for free you provide some value in return[1]. No … I’m not asking for money. What you offer is up to you. One suggestion is that if you found any value in these data you can share this article with somebody who may also find some value. If you prefer to return value for the value you received in some other way, that’s up to you. If you didn’t find any value, I’m sorry to hear that and thank you for stopping by.
Image credit: Open AI Dall-E 2: https://openai.com/dall-e-2/
U.S. DATA ANALYSIS
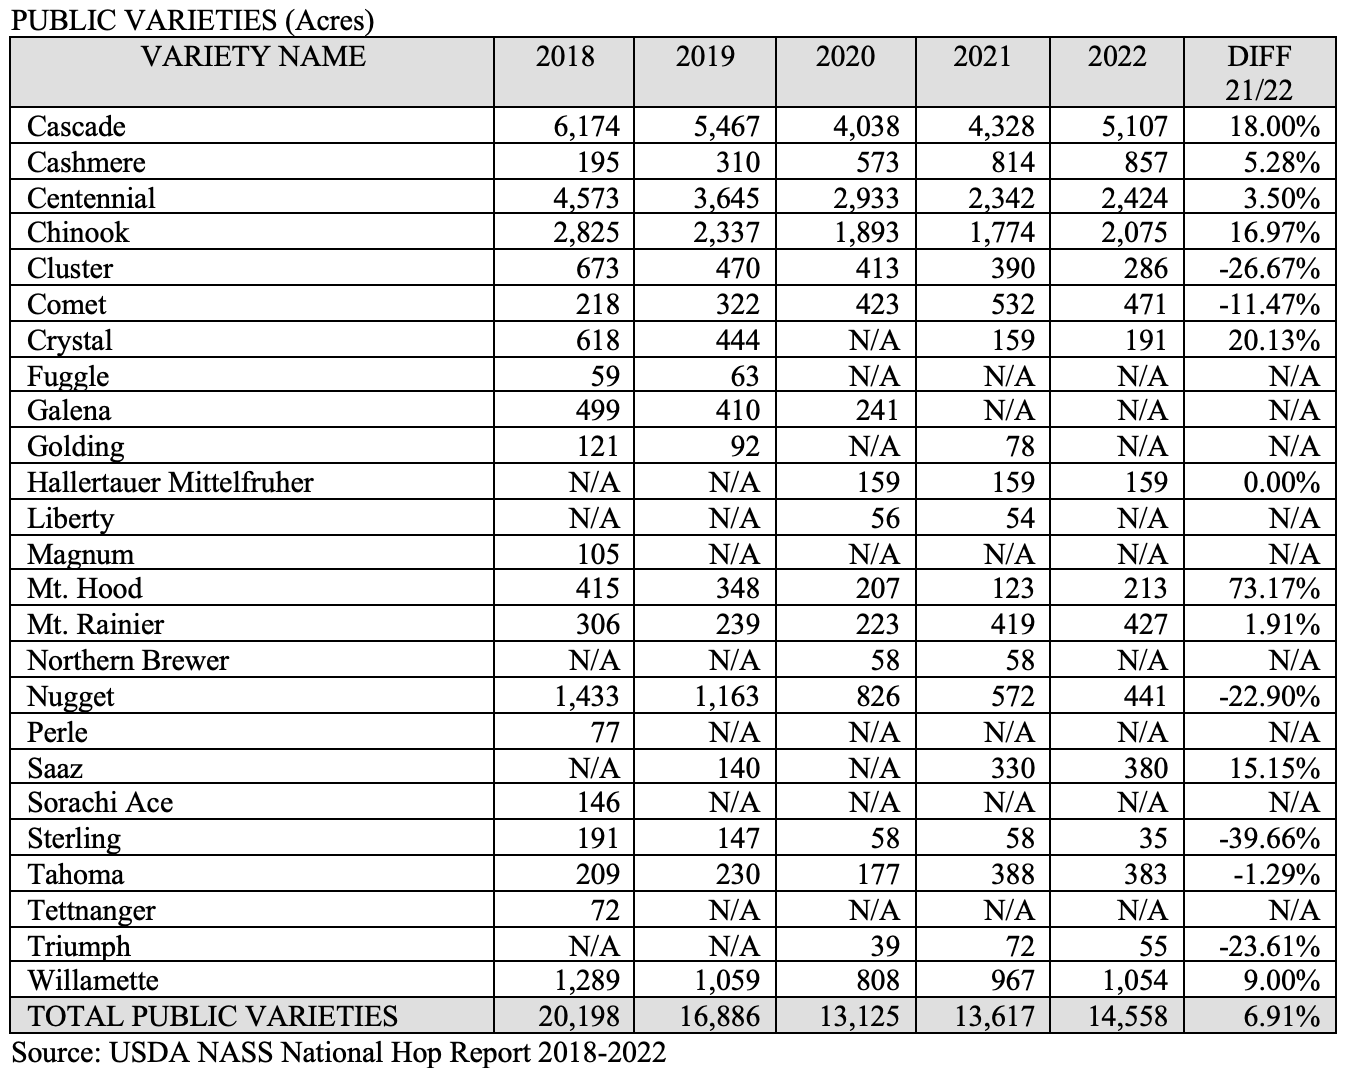
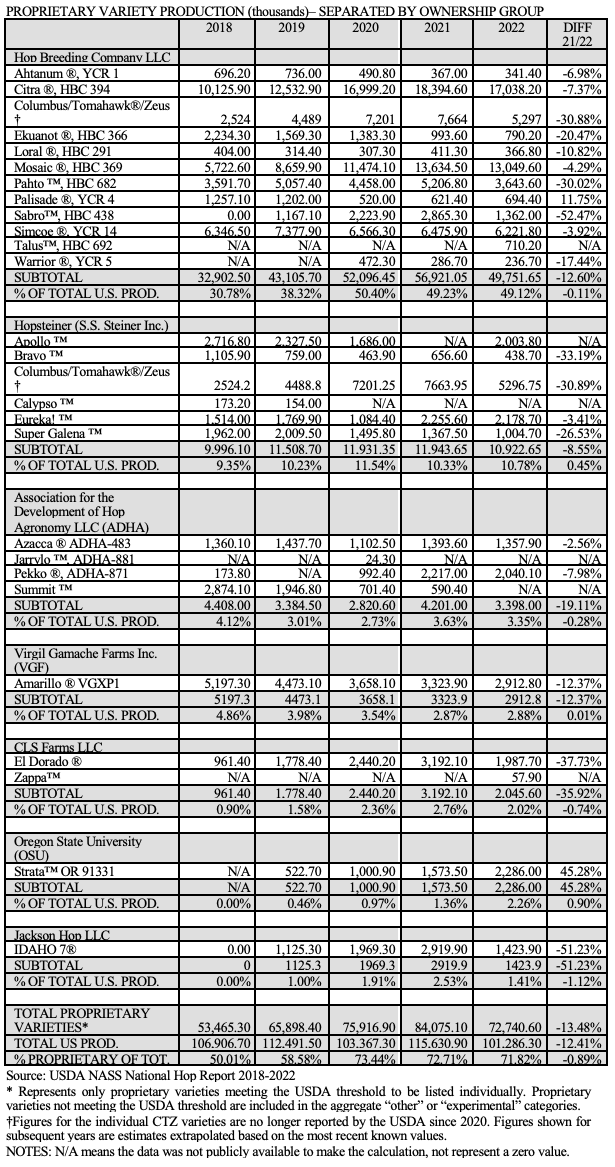
The USDA delivers variety-related information and lists the varieties by state, which is a great way to view the data. Another way to view variety information is to focus on the variety regardless of the location where it was produced. Throughout this report varieties are separated in this way. To begin we will look at acreage by proprietary (Figure 1), public (Figure 2) and “other” / “experimental” (Figure 3) varieties.
The Hop Growers of America (HGA) Statistical Packet (the Stat Pack) is convenient because it collects USDA and other raw data from several different sources in one place. The Stat Pack leaves the analysis and interpretation of the data it presents to the reader. In doing so, it avoids controversy. The current version of the HGA Statistical Packet likely contains the maximum amount of analysis possible while promoting and increasing sales of U.S. hops[2] and not offending one of its members.
The BarthHaas® Report and the Hopsteiner Guidelines for Hop Buying provide valuable information. They are well produced and full of inciteful wisdom. The hop and brewing industries should be grateful for the information they provide considering the intensity of the ongoing battle for market share. To my knowledge, Yakima Chief Hops® produces no such public report.
While the data herein are presented in a unique format, they are intended to be used together with the traditional USDA report found here for a more complete understanding of industry dynamics.
U.S. Acreage by Variety 2018-2022
Figure 1. U.S. Hop Acreage by Variety 2018-2022 (Proprietary)
Figure 2. U.S. Hop Acreage by Variety 2018-2022 (Public)
Figure 3. U.S. Hop Acreage 2018-2022 (Other and Experimental)
Commentary
In the era of proprietary variety dominance, separating variety acreage regardless of location provides a useful and meaningful perspective. The ownership of the varieties on 68% of U.S. hop acreage in 2022 was concentrated in a few hands. Acreage is the scarcest and most valuable resource. It is valuable to understand who influences that acreage and how. According to the World Intellectual Property Organization (WIPO) patent owners can decide who produces, uses, distributes, imports or sells their Intellectual Property (IP). Licensing agreements with the IP owners enable royalties[3]. The amount of acreage on which a company’s proprietary varieties are planted reflects their influence over their peers.
Further complicating the socioeconomic dynamic is the fact that the individuals who own the companies that own the branded variety IP own most of the processing capacity[4][5][6][7]. This concentration of power into a few hands expands the influence of those individuals. I documented the market concentration in my previous article entitled “Hop Supremacy”[8]. The power resulting from patents and licensing agreements enables IP owners to determine how much of their varieties make it to market[9]. In such a situation, contract farmers are reduced to production units. With respect to proprietary hop varieties, this fact remains unspoken. This is not so in other industries.
An article in the New Yorker explains a similar situation in the berry industry[10]. Driscoll’s senior vice president and general counsel said, “Growers are sort of like our manufacturing plants”. He continued, “We make the inventions, they assemble it, and then we market it, so it’s not that dissimilar from Apple using someone else to do the manufacturing but they’ve made the invention and marketed the end product.” Have farmers producing proprietary hop varieties in 2022 or the craft brewers who buy them realized the consequences of their actions beyond the profit they enable? Proprietary varieties transformed what were formerly independent hop farms into the agricultural equivalents of Chinese factories producing iPhones?
Proprietary variety owners may restrict supply. Their popularity has established a hierarchy and created additional barriers to entry, which reduces competition[11]. The result is less independence and self-censorship by those not at the top of the hierarchy. Whether these are desirable results depends on the perspective from which you view the industry. For all its flaws, the system may encourage farmers to produce even higher quality. High quality producers, after all, will be certain to receive production licenses in a future where fewer acres of proprietary varieties are needed. That future may be right around the corner.
The Five
Imagine a town of 100 people who have been neighbors for over a century. Many are related through marriage. Some are distant relatives. They know everything about one another like people in small towns do. They often gossip about each other. Some have unsettled rivalries. Some hate each other. Now imagine you suddenly convey a disproportionate amount of power, wealth and influence on five of those people. To complicate things further, the remaining 95 dependent upon those five for their survival. Some of the Goliaths who once enjoyed great power and influence did not end up among the five. They follow the marching orders of those who did. A century of jealousy, envy, greed and hatred are all silenced by the desire to survive. Friends of the five and those who pretend to be thrive under the new conditions. There is no happiness for their neighbor’s success, which, in their eyes came at their expense. Some strive to distinguish themselves in a quest to become one of the five. They will do anything. Opportunities exist, but they are not easily come by. That, I believe, is the effect proprietary hop varieties have had upon the American hop industry over the past 12 years.
U.S. PRODUCTION BY VARIETY 2018-2022
Figure 4. U.S. Hop Production by Variety 2018-2022 (Proprietary)
Figure 5. U.S. Hop Production by Variety 2018-2022 (Public)
Figure 6. U.S. Hop Production 2018-2022 (Other and Experimental)
Commentary
The comments on the acreage data Figures 1, 2 and 3 apply to production as well. What was not mentioned above is that a vast quantity of hops, 9.9 million pounds in 2021 and 7.2 million pounds in 2022 remain unreported in the “other” and “experimental” categories. This comes from the USDA threshold for reporting requirements, which are explained in a key on page five of the most recent USDA National Hop Report[12]. This is where a new variety’s statistics, proprietary and public, are listed as their popularity grows. It is where statistics for varieties on the decline reside. It’s where some varieties remain their entire existence as they never exceed the USDA reporting threshold.
That USDA threshold is one example of the desire for secrecy within the industry. Hop farmers do not like others to know the varieties they produce and their total acreage. Hop merchants will seldom comment about sales figures or their market share of sales to breweries. Hop farmers are not responsible for the USDA threshold. It is used in other crops as well[13]. Its existence makes the survey process more acceptable to hop farmers. Out of respect for the confidentiality those farmers would like to maintain, I do not publish those types of figures. Informally, within the industry, everybody knows the variety makeup and acreage of their neighbors. There are few secrets.
It is fair to assume, although the statistics cannot be made public, a significant portion of the “other” and “experimental” production in 2022 was proprietary. If added to the known proprietary production, the results would likely reveal that over 75% of U.S. hop production was proprietary in 2022. If it is not already obvious … that reveals a significant amount of control over the industry is already in private hands. I will present the market share of the varieties in a later section.
Image credit: Open AI Dall-E 2: https://openai.com/dall-e-2/
U.S. AVERAGE YIELDS BY VARIETY 2018-2022
Figure 7. U.S. Hop Average Yields by Variety 2018-2022 (Proprietary)
Figure 8. U.S. Hop Average Yields by Variety 2018-2022 (Public)
Figure 9. U.S. Hop Average Yields 2018-2022 (Other and Experimental)
Commentary
In theory, a variety’s yield should be one of the characteristics determining price. The higher the yield, the lower the price … all things being equal. This is the logic presented on page five of the 2020 Washington State University Cost of Hop Production Survey[14]. In a December 2022 article called “Hop Supremacy”, I highlighted what in my opinion are some of the more questionable aspects of that survey[15]. You can read it here if you’re interested.
Using the logic that yield should somehow influence price, a quick glance at the data from figures 7, 8 and 9 reveals that all but a few proprietary varieties should be priced lower than public varieties. If that is not the case, a brewer might want to ask why not. Is it that the hop farmer (whose production of proprietary varieties is regulated by the IP owner) cannot keep up with demand? In a market with inelastic demand (where customers need a certain amount of the product regardless of price), as is the case with hops, small changes in supply can make a big difference in the price as explained in this Masterclass[16]. From my decade long experience as an international hop merchant, the reported cost of production and yields of American hops have very little, if anything, to do with how prices are determined. That, in my opinion, is a myth perpetuated to increase prices. Of course, I could be wrong. If so, I would appreciate learning where my interpretation has strayed from the truth and invite anybody who disagrees to help me with that.
U.S. MARKET SHARE OF ACREAGE BY VARIETY
Figure 10. U.S. Hop Market Share of Acreage by Variety 2018-2022 (Proprietary)
Figure 11. U.S. Hop Market Share of Acreage by Variety 2018-2022 (Public)
Figure 12. U.S. Hop Market Share of Acreage 2018-2022 (Other and Experimental)
Commentary
For any variety, a brewery’s concern is whether they can purchase enough of that variety to meet their needs. How many acres and how much production are available were relevant questions. The market share of a variety’s acreage and production take on additional relevance with the presence of proprietary varieties. It conveys the influence and socioeconomic power of the companies that own the IP. The market share of one variety relative to each other would be meaningless otherwise.
“Who controls the past, controls the future: who controls the present, controls the past.”
- George Orwell, 1984
Image credit: Open AI Dall-E 2: https://openai.com/dall-e-2/
U.S. MARKET SHARE OF PRODUCTION BY VARIETY
Figure 13. U.S. Hop Market Share of Production by Variety 2018-2022 (Proprietary)
Figure 14. U.S. Hop Market Share of Production by Variety 2018-2022 (Public)
Figure 15. U.S. Hop Market Share of Production 2018-2022 (Other and Experimental)
Commentary
In 1989, around the time when private hop breeding programs began in the U.S.[17], the HGA Stat Pack listed “other” production as 4.27%, 3.89% and 3.57% for 1987, 1988 and 1989 respectively. The percentage in of production listed as other in 2020 through 2022 (Figure 15) is roughly double the percentage listed 1987-1989. Acreage in 2022 is approximately double that of 1987. In pounds produced for the “other” and “experimental” category, that translates into a quadrupling of the pounds reported in these categories since the introduction of proprietary varieties to the industry (Figure 6).
Fun Fact: The percent of “other” acreage peaked in 2010, 2011 and 2012 when the USDA reporting 20.64%, 18.84% and 19.24% of U.S. acreage in the “other” or “experimental” category respectively. The reason for the spike was that for a decade acreage and production for the entire State of Idaho was listed as “other”.
Figure 16. U.S. Proprietary Variety Acreage – Grouped by Variety Ownership
“If we clear a path to the creation of compelling electric vehicles, but then lay intellectual property landmines behind us to inhibit others, we are acting in a manner contrary to that goal.”[18]
- Elon Musk
Figure 17. U.S. Proprietary Variety Production – Grouped by Variety Ownership
Commentary
On the surface, it may appear that there are many independent sources from which you can buy American proprietary varieties. This is not the case. Some merchant companies are “strategic partners”[19] or “distributor partners”[20] with a larger merchant firm tied by licensing agreements to the companies that own those varieties. Others were acquired outright. One example of this is the John I. Haas acquisition of Yakima Valley Hops[21]. The companies with more restrictive practices select the farms on which their varieties will be produced. They select specific merchant companies through which they market their proprietary products. They do not make their varieties available to any merchant who would like to buy them. The brands they have developed backed up by property rights that variety patents and trademarks afford was a brilliant strategy to gain market dominance. IP rights facilitate the use of proprietary varieties to create a competitive advantage for them and their allies. Craft brewer preference for proprietary aroma varieties has fueled the war between merchants for market share that has existed in the hop industry for decades.
The Five Largest IP owners by Acreage:
The Hop Breeding Company, (HBC) is a joint venture between John I. Haas and Yakima Chief Ranches[22]. There is a short backstory of the HBC on their website. John I. Haas is part of the BarthHaas Group[23]. Yakima Chief Ranches is owned by the Carpenter, Smith and Perrault families[24]. These three families were instrumental in creating and continue in their role as owners of Yakima Chief Hops®[25].
Hopsteiner is a family-owned business run by the Gimbel family from their headquarters in the Trump Tower in New York City[26]. The company recently entered into a licensing agreement with CLS Farms of Moxee to produce four of its proprietary varieties[27]. I could not find any information regarding the company’s breeding program on their website, here is one article with a general description of their efforts and here is another.
The Association for the Development of Hop Agronomy (ADHA) is a partnership between Roy Farms, Greenacre Farms and Wyckoff Farms[28]. In 2022, the ADHA offered exclusive sales, marketing and distribution rights to John I. Haas for two of their existing ADHA varieties as well as future ADHA aroma varieties in development[29]. There is very little information about ownership on the ADHA website[30].
Virgil Gamache Farms, Inc. is owned by one of the Gamache families in the Yakima valley. They introduced the Amarillo® brand proprietary variety into the market before proprietary varieties were popular. There’s a nice origin story of the farm if you’re interested on their website.
CLS Farms owned by the Desmarais family of Moxee, Washington. They own the El Dorado® variety among others. There’s a nice article on their origin story with a cute picture of Eric and his family, which you can read here if you’re interested[31].
Image credit: Open AI Dall-E 2: https://openai.com/dall-e-2/
SEASON AVERAGE PRICES
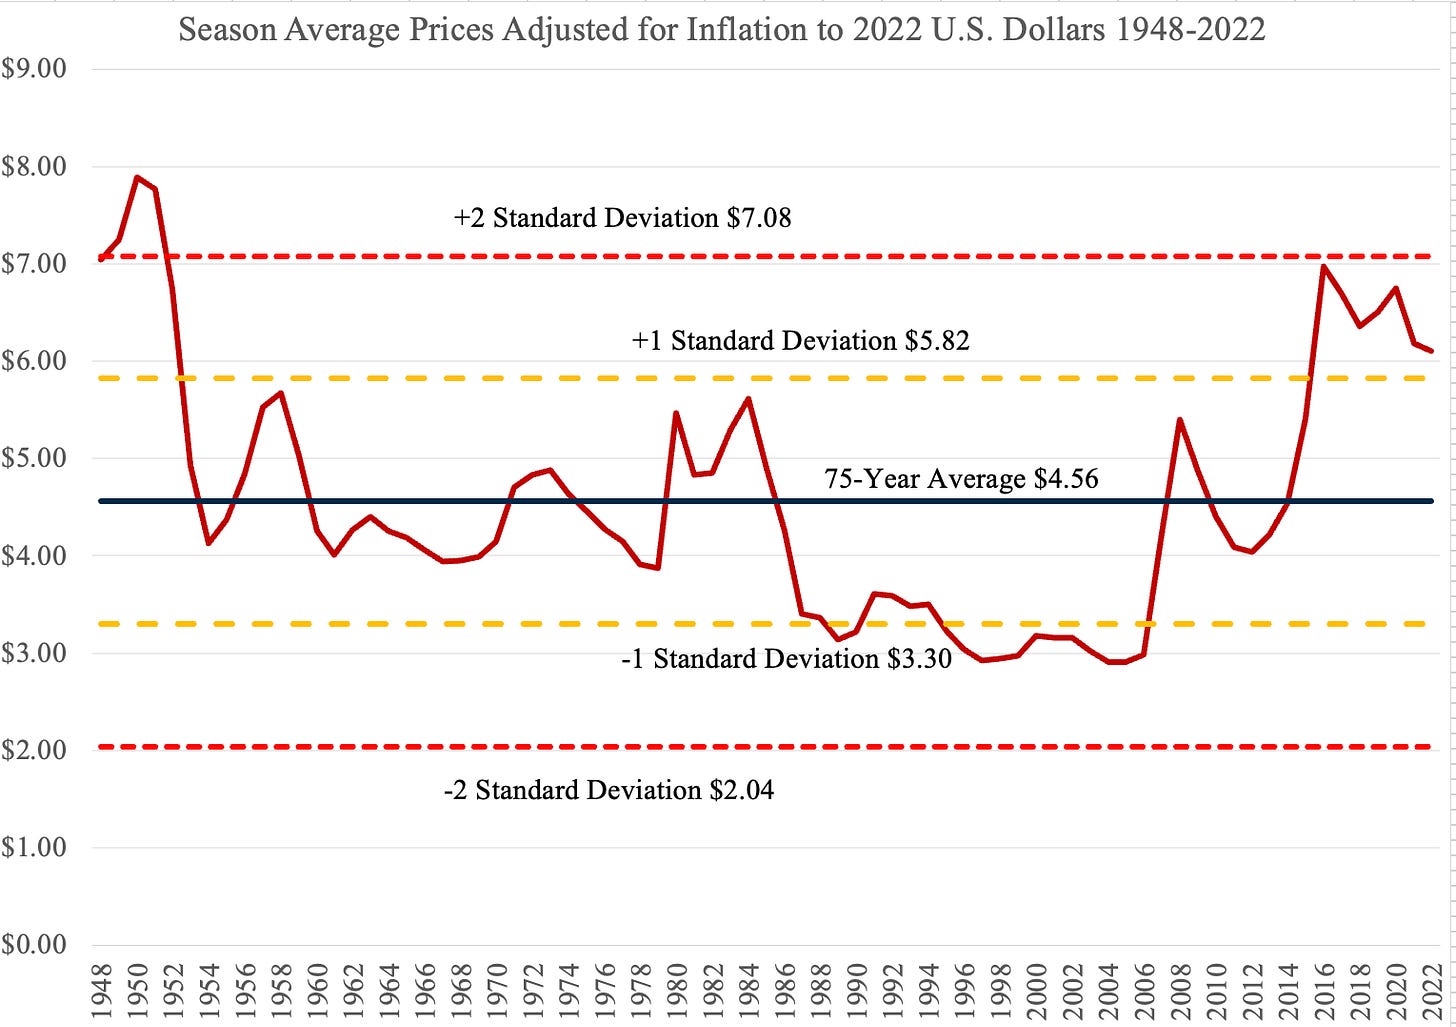
Figure 18. U.S. Season Average Price Raw Price and Inflation Adjusted to December 2022 (1948-2022)
Source: USDA NASS
Source: USDA NASS, U.S. Inflation Calculator[32]
Commentary
You would have to go back to 1952 to find prices as high prices for U.S. hops have been between 2016 and 2022. To put that into perspective, the late Queen Elizabeth had just assumed the throne, German hop production was reentering the supply chain following World War II, Eisenhower was elected President of the U.S., and the U.S. hop industry was newly freed from its second Federal Marketing Order to regulate the available hop supply in the market.
Inflation in 2022 affected farmers’ cost of production. Of that, there is no doubt. There are many flaws in the current long-term contract system. One that farmers will sympathize with in 2022 is that it does not allow for quick reactions to significant market changes. Brewers often demand contract renegotiations when they have high priced contracts and hop prices are declining. When the opposite is true, as happened in 2022, contract renegotiation is not an option. Some brewers threaten to sue producers and merchants if those contracts are not honored. Others go dark. It’s a double standard I will discuss in a future article … as I have plenty of experiences with that. There are strategies farmers use to cope with difficult times. Some of the old timers who are still around have plenty of experience in this arena. One farmer strategy I have seen under similarly changing circumstances is to underdeliver lower priced contracts claiming a poor yield and deliver on contracts that offer a higher return. Farmers may also deliver higher moisture levels to get paid for water weight instead of hops. As things get more financially challenging in the future, these and other tactics are likely to surface.
“Все счастливые семьи похожи друг на друга, каждая несчастливая семья несчастлива по-своему”
“All happy families are alike; each unhappy family is unhappy in its own way.”
- Leo Tolstoy, Anna Karenina
Inflation is part of the reason that the value of season average prices appears to be on the decline in 2021 and 2022. Farmers worldwide will certainly try to correct that by increasing prices for the hops they produce in future years. Rightly so. The starting point for those negotiations will be the key. Brewers and others buying American hops should be cautious of the claims made in the 2020 WSU Cost of Production survey. That report states that to breakeven an American farmer needs $13,588.67 per acre. To understand why that may not be the case, please see my October 15, 2022, article entitled “How Much do Hops Really Cost?”[33] and my more recent article entitled “Hop Supremacy”[34]. Things are not what they seem.
I will discuss another reason for declining season average hop prices in my next article. If you like this sort of information, you won’t want to miss that one.
U.S. HOP INVENTORY LEVELS
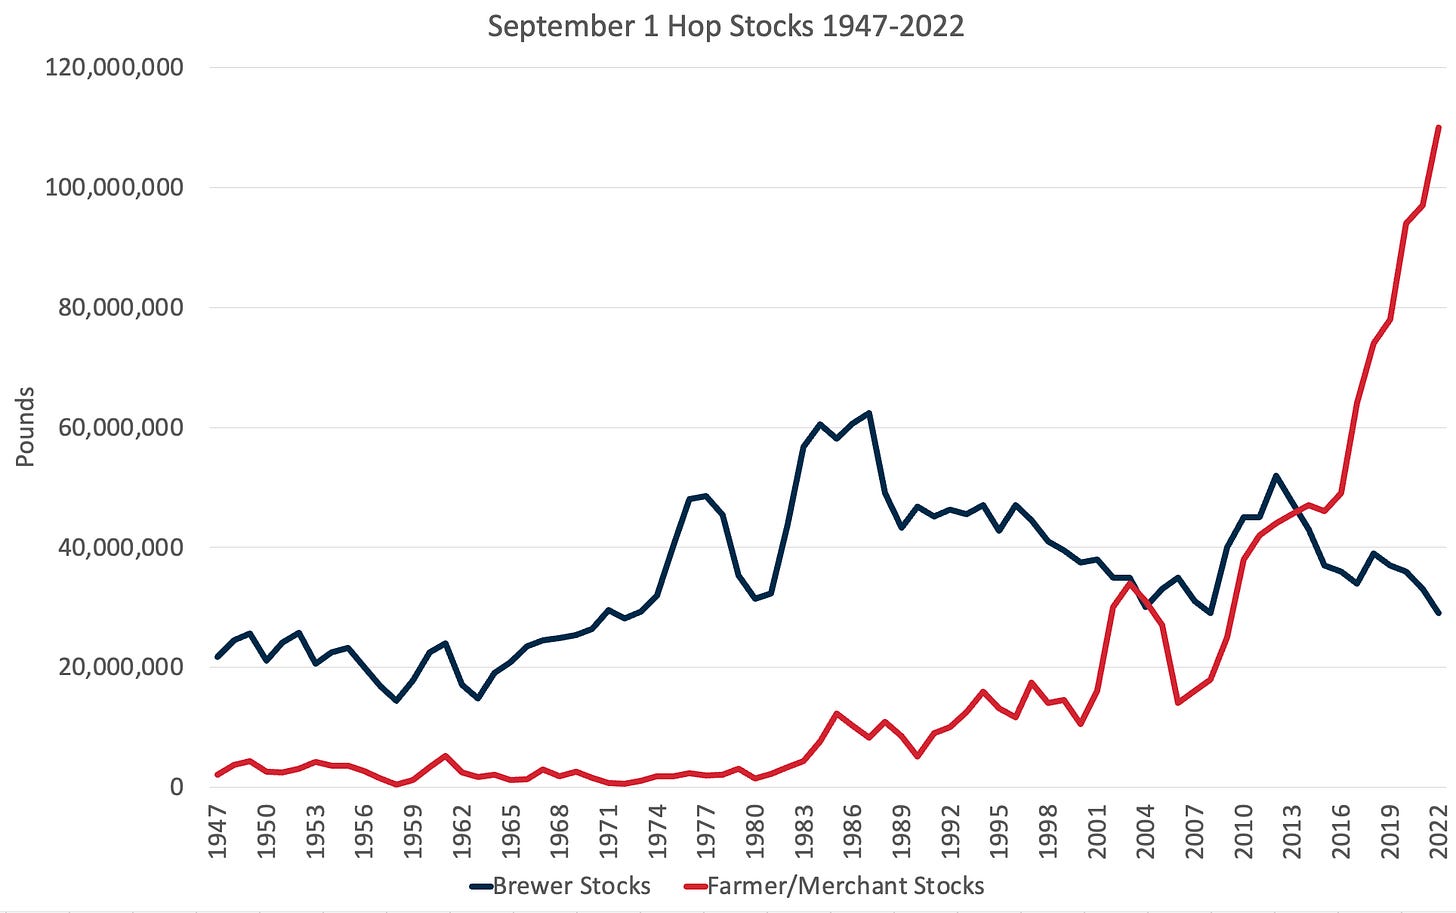
Figure 20.
Figure 21.
Commentary
The stocks report, when graphed as in figures 20 and 21 show a new trend in inventory possession that began in 2007-2008 and accelerated in 2016. Many in the hop industry would like to suggest it is normal for inventory to increase as the size of the industry increases. On the surface, that appears to be a logical argument. What is unusual, is that we do not see the brewer stocks and farmer/merchant stocks moving higher together as they should using this logic. Something has changed. Farmer/merchant stocks have soared while brewer stocks declined following 2016. Why did the relationship between brewer stocks and farmer/merchant stocks changed to the extent it did after 2007? That was the time when craft beer in the U.S. soared. It was the time when proprietary variety acreage surged to over 70% of U.S. production. It was a time when prices rose to 70-year highs when adjusted for inflation.
As usual, answers to questions like these are never simple. The most likely answer is that it is a result of several factors combined. Some of the possibilities to consider:
Craft brewers purchased more hops than necessary. They did not take delivery within the first year after the hops were produced (for this to be true, based on the slope of the curve, the rate at which that happened accelerated between 2016 and 2022.),
Long-term contracts forced brewers into longer agreements for which they could not accurately forecast demand. Unlike their macro brewer counterparts that enjoy different rights due to their size and purchasing power, craft brewers could not demand those contracts be terminated once they realized the problem[35]. They were forced into contract renegotiations as a result,
Farmers producing for existing long-term contracts were not keen to reduce acreage when necessary. They continued to produce and increase acreage according to their contracts regardless of market signals to the contrary,
Those managing the supply of proprietary varieties, perhaps in a quest for increased market share or greater profits, were not responsive to signals of reduced demand between 2016 and 2022. Until 2022, very few reductions in proprietary varieties occurred (Figure 1),
Restricting access of proprietary varieties to the market to a limited distribution network rather than allowing merchants around the world to purchase, take delivery of, and store these varieties restricted the flow of hops out of central storage facilities counted in this survey and changed the rate of movement of those varieties worldwide,
The ever-increasing prices for proprietary varieties slowed the movement of hops into brewer storage facilities.
There are probably more potential reasons for the change. I’d love to hear if you can think of other reasons not mentioned above. The logic that the hop industry is larger alone explains some of the increased inventory but does not explain the increased ownership of the stocks by farmers and merchants. Possession, as they say, is nine tenths of the law, which means that farmers and merchants own these hops that are sitting in storage longer … regardless of what a contract may imply.
In my opinion, the graphs in figures 20 and 21 above are evidence that demand for U.S. hops is slowing relative to production. More importantly, they suggest a structural capacity to overproduce. Poor crop performance in 2022 in the U.S. and across the EU were a blessing in disguise. The lack of a corresponding surge in prices is significant. A similar set of circumstances occurred in 2003 when the German crop was down 21%. No corresponding price increase occurred. It was a clear signal of surplus conditions. Unlike in 2003, in 2022 the capacity to produce has been on the rise in recent years rather than on the decline. I will discuss more on this in my next article and explain why this is such a serious problem. I think everybody will want to tune in for that. With that in mind, I’d like to ask you to please share this Substack with anybody you think might find value from this type of information.
Image credit: Open AI Dall-E 2: https://openai.com/dall-e-2/
THE DEPLETION RATE
Annual Depletion
The annual depletion rate demonstrates demand for hops that were moved out of storage between the September 1 stocks report of year n-1 and the September 1 stocks report of year n. Depletion is measured by the change in inventory levels. This includes American and foreign hops in storage in the U.S. during that time. Figure 22 shows the difference in stocks and the change in inventory levels over the course of a year relative to the crop from the previous year. Figure 23 adds in the inventory that was available on September 1 (year n-1) to present a more accurate picture of available hop supply. A summary of the importance of the following six graphs, which are a bit technical, will be provided following figure 27.
---
Figure 22. US Annual Depletion rate September (year n-1) through September (year n) Relative to the Crop of year n-1.
Source: USDA Hop Stocks Reports 2002-2022
---
Figure 23. US Annual Depletion rate September (year n-1) through September (year n) Relative to the Crop (year n-1) plus Stocks (year n-1) (i.e., available hops in the U.S.)
Source: USDA Hop Stocks Reports 2002-2022
Commentary
Inventory is measured twice each year, on September 1 and on March 1. It is possible to analyze the movement of hops out of inventory between September 1 (year n-1) and March of the following year (year n) (Figure 24) and between March (year n) and September (year n) may be measured (Figure 25). When the inventory is removed is significant.
Figure 24. September (year n-1) – March (year n) Depletion Rate Relative to Previous Crop 2002-2022
Source: USDA Hop Stocks Reports 2002-2022
Figure 25. March (year n) -September (year n) Depletion Rate Relative to Previous Crop 2002-2022
Source: USDA Hop Stocks Reports 2002-2022
Figure 26. September (year n-1) – March (year n) Depletion Rate Relative to Previous Crop plus September (year n-1) Stocks 2002-2022
Source: USDA Hop Stocks Reports 2002-2022
Figure 27. March (year n)-September (year n) Depletion Rate Relative to Previous Crop plus September (year n-1) Stocks 2002-2022
Source: USDA Hop Stocks Reports 2002-2022
Commentary
That is a lot to digest. It is significant information that is not reported elsewhere. These data represent the movement of hops out of inventory. There are three ways to gauge the level of demand 1) inventory depletion, 2) price, and 3) the level of forward contracting. With regards to inventory depletion, if the U.S. produces a short crop, as it did in 2022, the depletion rate will increase in the following year because the base to which it is being compared decreased. This will be true unless demand has fallen during that time. It is important to note because production must be factored into the equation to get a more accurate read on changes in demand. We should expect the 2023 Sept-Mar depletion rate to increase. If it does not increase to the degree expected, that will signal a reduced demand for hops. It is possible to use these numbers to calculate and better understand the state of equilibrium in the market (i.e., the relationship between available supply relative to demand).
In recent years, following harvest the equivalent of two to three crops have been sitting in storage in the U.S. Most of that inventory belongs farmers and merchants (Figures 20 and 21). An ideal situation … if you believe an extra year of hop inventory should be held in storage in the first place … would be for an equal distribution of 50% depletion between September and March and 50% depletion between March and September relative to the prior year’s crop production. That would change to 25% between September and March and an additional 25% between March and September relative to crop production plus hop inventory under the same assumptions. If you believe more or fewer hops should be held in storage for brewers, you may adjust these numbers accordingly. Their presence may itself affect the belief by some brewers as to how much must be held as it can inspire confidence in future supply.
The changing variance of the depletion from year to year is an indicator of changes in the supply/demand situation relative to the available supply (i.e., the urgency of demand or lack thereof due to a surplus or deficit situation). The data from 2022 demonstrates depletion rates are changing in a direction that indicates building inventories. In 2023, depletion will appear to increase due to decreased production in 2022. The result, nevertheless, will be a growing surplus of millions of pounds in American warehouses unless 2023 acreage decreases significantly. An inventory buildup is a signal to reduce production to be more in line with demand. More on that in my next article.
The significance of the six-month depletion calculations (Figure 23-27) when graphed over time represents inventory depletion velocity. Depletion velocity indicates the changing degree of equilibrium in the market (i.e., surplus or deficit and the urgency with which breweries require the available supply). The current situation indicates a surplus situation in the United States in 2022 going into the 2023 calendar year.
A question for brewers … Who pays for all that inventory sitting in storage? You do! … That’s true whether those are your hops in storage or not. It’s like insurance. When there is a disaster and insurance companies must pay out large amounts, they increase premiums for those who received payments, but also for future policies in that category. Every brewer is paying for those hops to sit in storage. In fact, the brewing industry relies upon the hop industry to finance two years of its inventory at a time. I’ll get into the details of that and how much it’s costing the brewing industry in a future article. For now, consider this … The average farmgate value of a crop over the past five years is $618.5 million[36]. If two crop years of hops are sitting in storage, when processing, storage and other costs are considered, the value of that product is over $1.5 billion. The money to pay for the costs associated with storing that comes from one source.
A question for the bankers working with hop merchants or farmers … Who owns those hops in storage? You do! Until a customer pays for their hops or a merchant uses profits from other sales to pay them off, those hops belong to the bank. American bankers value contracts with American brewers at face value plus the value of inventory in storage as collateral for lines of credit. They discount contracts with foreign entities. In some cases, they assign foreign contracts a zero value. Most American farms and merchant companies would be much smaller without such liberal bank financing. Who owns those hops in storage is a lot like a game of musical chairs. You only know who grabs a seat once the music stops.
---
FINAL THOUGHTS
I will provide an analysis of these data combined with geopolitical events that I believe will affect the hop industry in the coming year in my next article on or around February 1, 2023.
I would like to sincerely thank you for the time you invested in reading this article. If you enjoyed it and you have not already subscribed, please consider doing so now so you’ll receive any future articles as soon as they are released.
[1] https://value4value.info/about/
[2] https://www.usahops.org/about/
[3] https://www.wipo.int/patents/en/faq_patents.html
[4] https://www.natex.at/about-us/project-references/worlds-largest-hops-extraction-plant/
[5] https://www.craftbrewingbusiness.com/ingredients/watch-this-deep-dive-video-on-yakima-chiefs-co2-hop-extract/
[6] https://www.inside.beer/news/detail/germany-the-worlds-largest-hops-extraction-plant-goes-into-operation/
[7] https://www.hopsteiner.com/processing-and-logistics/
[9] https://www.wipo.int/patents/en/faq_patents.html
[10] https://www.newyorker.com/magazine/2017/08/21/how-driscolls-reinvented-the-strawberry
[11] https://www.oecd.org/competition/mergers/37921908.pdf
[12]https://www.nass.usda.gov/Statistics_by_State/Regional_Office/Northwest/includes/Publications/Hops/2022/hopsan22.pdf
[13] https://downloads.usda.library.cornell.edu/usda-esmis/files/x633f100h/t148gn52h/4b29cb406/pspl0322.pdf
[14] https://pubs.extension.wsu.edu/2020-estimated-cost-of-establishing-and-producing-hops-in-the-pacific-northwest
[16] https://www.masterclass.com/articles/elastic-vs-inelastic#6fTcAy4OnwLSAevTM5ZcZS
[17] https://www.yakimachiefranches.com/about/
[18] https://www.tesla.com/blog/all-our-patent-are-belong-you
[19] https://careers.yakimachief.com/fresh-hops-in-korea/
[20] https://careers.yakimachief.com/yakima-chief-hops-presents-3rd-annual-contribution-to-pink-boots-society-scholarship-fund/
[21] https://www.johnihaas.com/news-views/john-i-haas-makes-strategic-investment-in-yakima-valley-hops-extending-reach-into-global-home-brewing-and-small-craft-brewing-markets/
https://www.hopbreeding.com
[23] https://www.johnihaas.com/about-us/
[24] https://www.yakimachiefranches.com/about/
[25] https://www.yakimachief.com/commercial/about-us/our-company
[26]https://www.google.com/maps/place/Hopsteiner/@40.762461,-73.9760587,17z/data=!3m1!5s0x89c259a1e735d943:0xb63f84c661f84258!4m5!3m4!1s0x89c259b6bd63a6c3:0x2b88dc98c69489eb!8m2!3d40.762457!4d-73.97387
[27] https://www.brewbound.com/news/supplier-news/hopsteiner-licenses-cls-farms-to-grow-and-market-four-of-its-proprietary-varieties/
[28] https://www.globenewswire.com/en/news-release/2021/10/29/2323909/0/en/Association-for-the-Development-of-Hop-Agronomy-ADHA-Partners-with-John-I-Haas-HAAS-to-Exclusively-Market-and-Distribute-Its-Proprietary-Aroma-Hops.html
[29] https://www.johnihaas.com/news-views/association-for-the-development-of-hop-agronomy-adha-partners-with-john-i-haas-haas-to-exclusively-market-and-distribute-its-proprietary-aroma-hops/
[30] http://adha.us/about-adha
[31] https://www.hoptalk.live/post/desmarais-family-origin-story-growing-hops-in-yakima
https://www.usinflationcalculator.com
[35] For those who don’t know, following a surge in five-year contracts for alpha hops signed in 2007-08 by macro brewers, those same brewers in 2009 and 2010 (i.e., once the supply situation had stabilized) demanded the cancellation of those contracts. IHGC sold ahead data between 2007-2011 reveals the extent to which this occurred.
[36] https://www.usahops.org/img/blog_pdf/405.pdf


