


EXECUTIVE SUMMARY
The industry is undergoing what will be the largest contraction of acreage and concentration of power in history. At the time of this writing, there no noticeable effect of the previous three years of acreage reduction on the market. Prices continue to decline while stocks continue to rise. That will change in 2025, but it will be years before the desired effects from the acreage correction takes hold. Contracts forced upon brewers are wonderful for the recurring revenue they provide merchants and farmers. They would be the perfect instrument if they were a real indicator of demand as claimed, and if it could be decoupled from greed. Contracts represent a brewer’s best guess at future sales. The longer the contract, the less accurate the guesses. During the past cycle, as always happens, breweries were told they must contract for volumes for five years or they cannot be guaranteed the hops they need. I remember telling brewers this myself when I was a dealer because that is what I had to do to get the hops from the farmer. In my December 2024 article entitled “2025 Hop Industry Changes”, I discussed the anatomy of a hop cycle.
What I did not mention is that this is the point in the market cycle when brewers are angry. They’re upset at hop merchants for locking them into long-term prices for hops they do not need a prices much higher than they could get on the spot market. This hasn’t happened since 2009 due to the unusual length of the boom market that recently ended, but it happens every time. The feeling many brewers have now … that they were exploited … is justified. They were. It is also what keeps the cycle going. If the past is any indicator, the next few years will bring the brewer’s revenge, the next step in the tit-for-tat cycle. Proprietary varieties have the potential to shorten this part of the cycle if managed correctly. The depth of acreage reductions being discussed this week and next will determine how many more years the industry will suffer before balance is restored.
This report documents recent industry changes and provides valuable commentary and perspective. I hope you find it useful. If you do, please consider sharing it with a friend who may also get some value from it. If merchant/farmers are interested in transparency as many of them claim, they will be happy for this information to spread far and wide through the brewing industry.
SOMETHING NEW
Before we get into the details of this report, I would like to share something I’ve decided to do. From my 20+ years in the industry, I’ve learned how brewers buy their hops and the opportunities they miss to get better pricing when they do. I am confident almost every brewery can save 10% on their hop bill. Many can save a lot more. I want to help them do that so I’m making myself available to a limited group of breweries. Click on the add below to learn more. Space is limited so don’t wait.

U.S. HOP ACREAGE (in the Pacific Northwest)
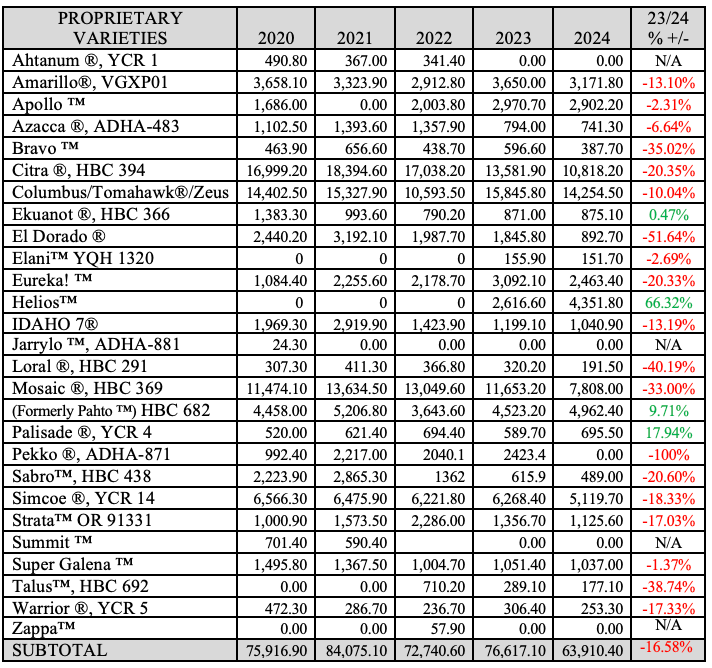
TABLE 1. U.S. PROPRIETARY HOP ACREAGE 2020-2024

SOURCE: USDA National Hop Report 2020-2024
NOTE: The USDA reporting requirements affect how the numbers are reported. If three unique farms do not produce a variety, it is not listed separately in a USDA report. For that reason, a variety like Pekko ®, ADHA-871 appears to have disappeared from the reporting in 2024. That does not mean Pekko ®, ADHA-871 acreage decreased to zero in 2024. Pekko ®, ADHA-871 acreage was added to the “other” hops reported total, which acts as a catch-all for all such varieties (Table 3).
COMMENTARY:
You can read the numbers for yourself. What is interesting is to notice as you do is HOW the numbers are changing. Public varieties are decreasing at a more rapid pace than proprietary varieties. It’s almost as if there is a coordinated effort behind the scenes to make this happen. As is the case in this New York Post article about a potato cartel, all those involved would certainly claim no wrongdoing and that the market was responsible any activity that appeared coordinated.
Brewers are demanding proprietary varieties, that’s true. Merchant promotional efforts are disproportionately aimed at selling their proprietary varieties rather than public varieties. They carry public varieties, of course. Proprietary varieties offer their owners millions in royalties and a competitive advantage for their merchant companies. Considering these incentives, it’s no surprise there are few posts on social media by the big companies for public varieties. Only the independent farmer has an interest in promoting public varieties.
Proprietary varieties enable their owners to limit supply. Had they listened to Louis Gimbel, CEO of S.S. Steiner in 2018 when he explained to Hop Growers of America convention attendees that there was already a hop surplus[1], things might be different today. Greed is a powerful motivator. It’s hard to say no to a brewer who insists he needs hops despite the ridiculous prices you’re quoting him. I’ve fallen for that in the past and I will help brewers not make the same mistake in the future.
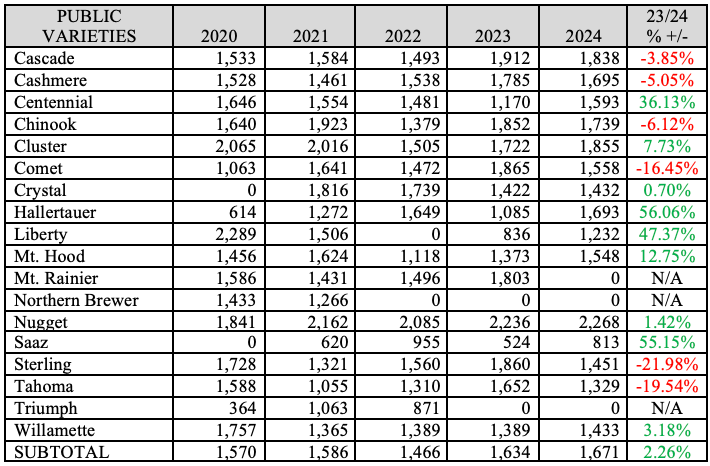
TABLE 2. U.S. PUBLIC HOP ACREAGE 2020-2024

SOURCE: USDA National Hop Report 2020-2024
TABLE 3. U.S. OTHER & EXPERIMENTAL HOP ACREAGE 2020-2024

SOURCE: USDA National Hop Report 2020-2024
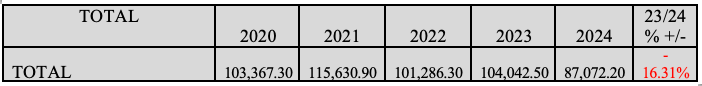
TABLE 4. TOTAL HOP ACREAGE 2020-2024

SOURCE: USDA National Hop Report 2020-2024
Figure 1. U.S. Pacific Northwest Hop Acreage 2012-2024
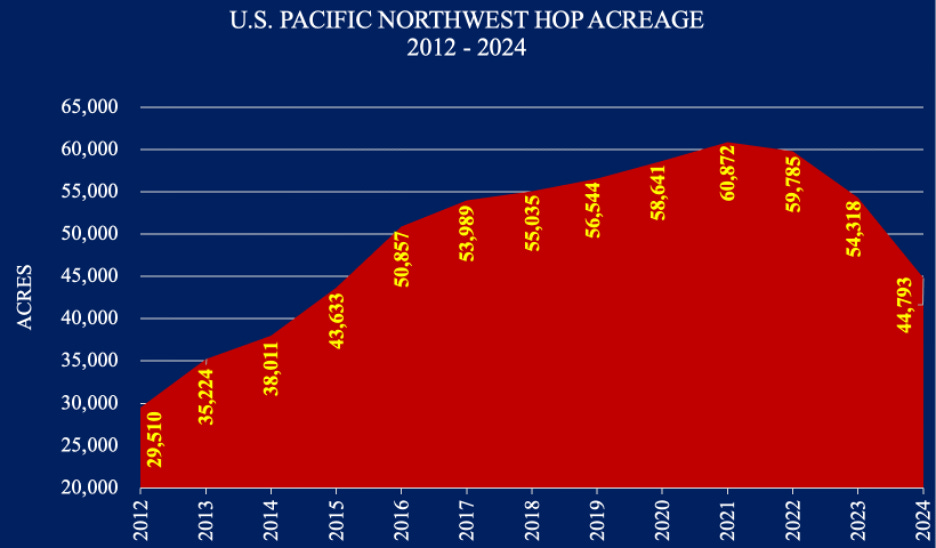
SOURCE: USDA NASS National Hop Reports 2012-2024
U.S. HOP PRODUCTION (in the Pacific Northwest)
TABLE 5. U.S. PROPRIETARY HOP PRODUCTION 2020-2024 (1,000s)
SOURCE: USDA National Hop Report 2020-2024
TABLE 6. U.S. PUBLIC HOP PRODUCTION 2020-2024

SOURCE: USDA National Hop Report 2020-2024
TABLE 7. U.S. OTHER & EXPERIMENTAL HOP PRODUCTION 2020-2024

SOURCE: USDA National Hop Report 2020-2024
TABLE 8. TOTAL HOP PRODUCTION 2020-2024
SOURCE: USDA National Hop Report 2020-2024
Figure 2. Composition of U.S. Hop Production.

SOURCE: USDA National Hop Report 2012-2024
U.S. HOP YIELD (Average by variety in the Pacific Northwest)
NOT ALL ACREAGE IS CREATED EQUAL
Boom years create inefficiencies. Farmers scrambling to increase acreage in response to rising prices leads to poor decision making. In the rush, hops are planted in fields with poor soil and in undesirable locations. With chemical fertilizers and pesticides and decades of experience, most farmers in the industry can grow hops even on the worst soil. Their yield is the issue. In poor soil or under undesirable growing conditions, hops are more expensive to produce, and the quality may be lower than normal. U.S. hop acreage doubled between 2012 and 2021[2]. During that time, proprietary variety production grew to triple its original size (Figure 3).
Figure 3. Increase in U.S. Proprietary Variety Production 2012-2021

SOURCE: USDA NASS National Hop Reports 2012-2021
During contractions, farmers remove their lowest yielding yards to improve farm efficiency. Inconvenient yards farther away from the picking facility or those that suffer from regular pest or disease infection (i.e., higher pesticide costs) are first to go. For that reason, assuming all other variables are equal, yields will continue to increase (Table 9). As lower yielding fields and varieties are removed, the cost of production per acre should decrease. That is never highlighted by hop industry groups. Their mission is to encourage increasing prices by creating the perception of value over cost.
TABLE 9. U.S. PROPRIETARY HOP YIELD 2020-2024 (1,000s)

SOURCE: USDA National Hop Report 2020-2024
TABLE 10. U.S. PUBLIC HOP YIELD 2020-2024
SOURCE: USDA National Hop Report 2020-2024
TABLE 11. U.S. OTHER & EXPERIMENTAL HOP YIELD 2020-2024

SOURCE: USDA National Hop Report 2020-2024
TABLE 12. TOTAL HOP YIELD 2020-2024

SOURCE: USDA National Hop Report 2020-2024
U.S. HOP VARIETY ACREAGE MARKET SHARE (in the Pacific Northwest)
TABLE 13. U.S. PROPRIETARY HOP ACREAGE MARKET SHARE 2020-2024
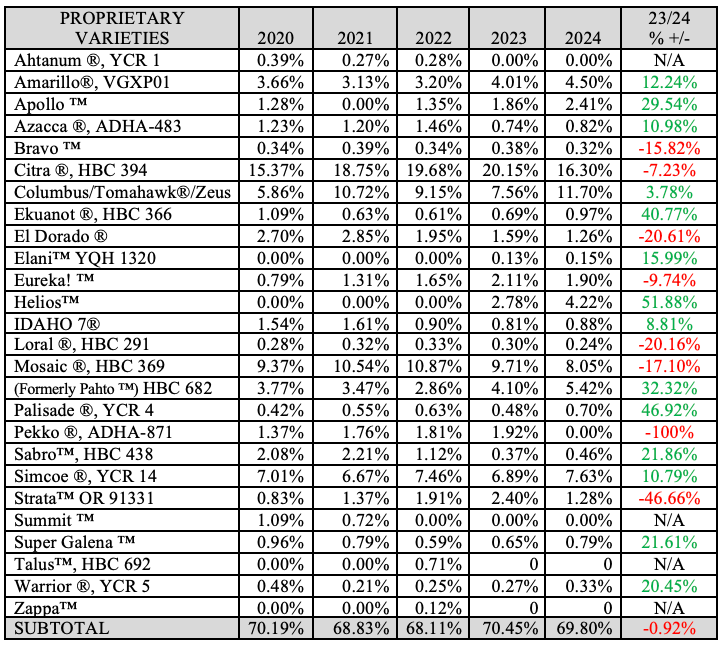
SOURCE: USDA National Hop Report 2020-2024
TABLE 14. U.S. PUBLIC HOP ACREAGE MARKET SHARE 2020-2024
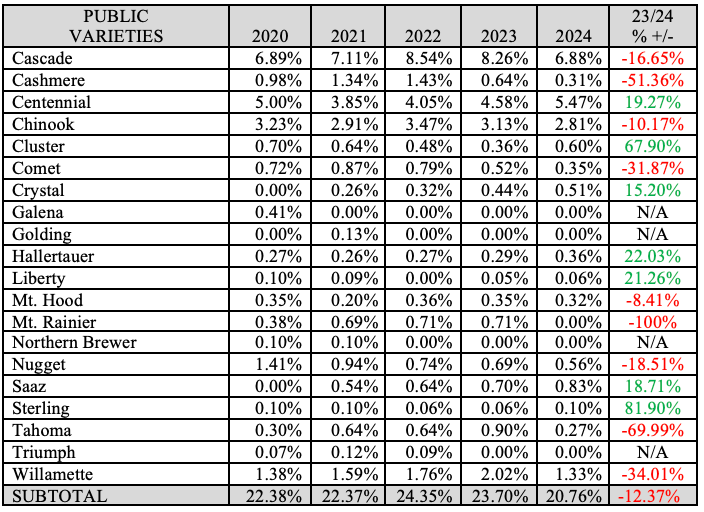
SOURCE: USDA National Hop Report 2020-2024
TABLE 15. U.S. OTHER & EXPERIMENTAL ACREAGE MARKET SHARE 2020-2024

SOURCE: USDA National Hop Report 2020-2024
MARKET SHARE OF 5 LARGEST PROPRIETARY VARIETY GROUPS 2020-2024[3]
Prior to the creation of proprietary varieties, it was never possible to know the market share of the different merchant companies. The figures below only represent the known proprietary variety acreage and production they control. It does not represent the public variety acreage they also sell. As such, these numbers represent the most conservative estimate of each company’s actual market share.
Changes in yield due to weather and other variables affect the market share figures in the graphs that accompany the following tables (Figure X, X, X, X, & X). They demonstrate the competitive nature of the proprietary game and that the two largest entities control
Table 16. Estimated 2024 Hop Breeding Company Production PNW Market Share %

SOURCE: 2024 USDA National Hop Report
Notes:
*Represents an estimate based on last known reported figures
† The HBC is a joint venture owned by John I. Haas and Yakima Chief Ranches … Yakima Chief Ranches is owned by the Smith, Carpenter and Perrault families. Members of these three families are also owners of Yakima Chief Hops™.
Figure 4. Five-Year Estimated Hop Breeding Company Proprietary Variety Production PNW Market Share %

SOURCE: USDA NASS National Hop Reports 2020-2024
Table 17. Estimated 2024 S.S. Steiner Proprietary Variety Production PNW Market Share %

SOURCE: 2024 USDA National Hop Report
Notes:
*Represents an estimate based on last known reported figures
Figure 5. Five-Year Estimated S.S. Steiner Proprietary Variety Production PNW Market Share %
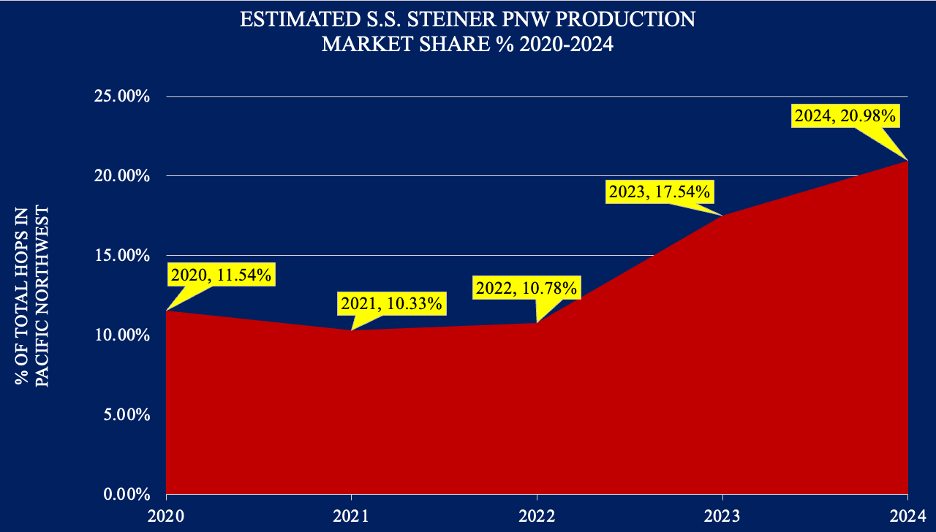
SOURCE: USDA NASS National Hop Reports 2020-2024
Table 18. VGF Proprietary Variety Production PNW Market Share %

SOURCE: 2024 USDA National Hop Report
Figure 6. Five-Year VGF PNW Proprietary Variety Production Market Share %

SOURCE: USDA NASS National Hop Reports 2020-2024
Table 19. OSU Proprietary Variety Production PNW Market Share %

SOURCE: 2024 USDA National Hop Report
Figure 7. Five-Year OSU PNW Proprietary Variety Production Market Share %

SOURCE: USDA NASS National Hop Reports 2020-2024
Table 20. CLS Proprietary Variety Production PNW Market Share %

SOURCE: 2024 USDA National Hop Report
Figure 8. Five-Year CLS PNW Proprietary Variety Production Market Share %
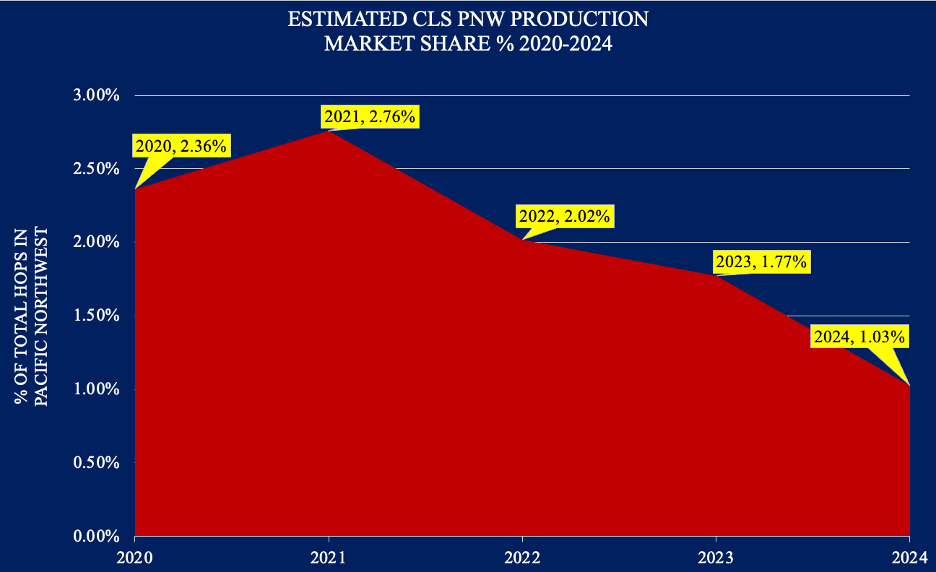
SOURCE: USDA NASS National Hop Reports 2020-2024
SAVE BREWERIES $10 MILLION
While I have you hear, I want to share one of my goals with you for the help I plan to provide to breweries. My goal is to save breweries $10 million on their hop purchases. I don’t think that will happen in the first year with the first group. Honestly, I think it will probably happen by year three. That depends on the size of the breweries that sign up. So, brewers, if you’d like to help me reach that goal, sign up today.
SAP RAW & ADJUSTED
Every year the USDA issues a Season Average Price (SAP) for the U.S. That number is a passive aggressive means for the industry to communicate the appropriateness (or inadequacy) of prices when compared with the cost of production the industry claims through the Washington State University Cost of Hop Production Survey. I detailed how the reported U.S. cost of production has been exaggerated by the hop industry since 2010 to the farmer’s advantage to make the brewing industry believe costs are much higher than they are. As they say, “The devil is in the details”.
They do this to anchor the idea of what hops should cost at a higher price level for negotiation purposes. If you’d like to read more about that, please see my October 15, 2022 article entitled “How Much Do U.S. Hops Really Cost?”. If you’re one of the hundreds of new subscribers to the MacKinnon Report in 2024, you may not have read that article. You should! It reveals the contempt members of the hop industry have had toward the brewing industry over the years. It explains how they inflate their reported costs. In the exciting conclusion to this State of the Hop Industry report, I’ll show how ridiculous those claims are. You won’t want to miss that! Using the information in that article, it is possible to calculate the real cost of production for hops. Industry groups will never do that. They don’t want, nor would they benefit from, such openness and transparency.
For additional perspective on prices, each year, it is valuable to take a longer-term view of U.S. season average prices. Converting them into current U.S. dollars offers more meaning than the raw data can convey (Table 21).
Table 21. U.S. Season Average Prices (SAP) Raw Data and Prices Adjusted for Inflation Using the Consumer Price Index to 2024 USD 1949-2024.
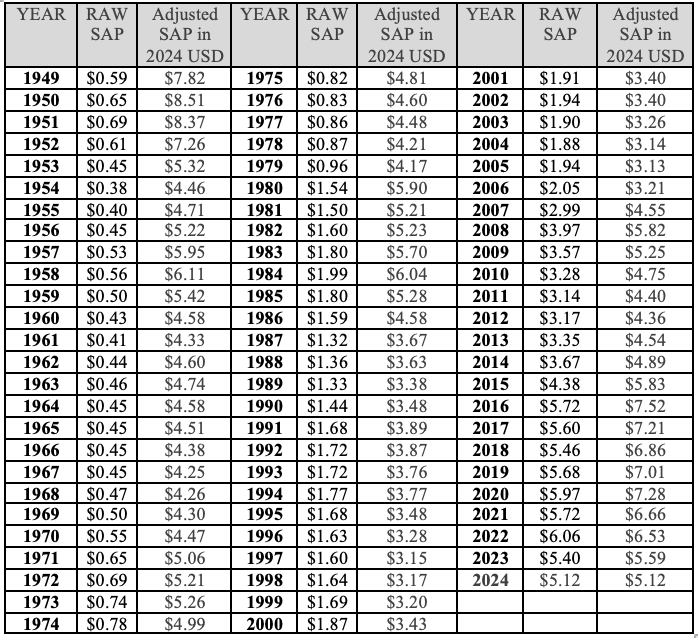
SOURCE: USDA NASS, Bureau of Labor Statistics
Raw unadjusted U.S. season average prices only show part of the picture. Relative to the previous year or two, they are relevant because we have lived through those times Figure X. It’s interesting, but it doesn’t tell the viewer much, only that this year’s price is higher or lower relative to last year.
Figure 9. Raw SAP

As is the case with most data, a broader more historic view offers greater perspective. By looking back at the previous 75 years of U.S. season average price data and adjusting it for inflation into 2024 Dollars, we can compare the highs and lows points from previous boom and bust cycles. The current price relative to the 75-year average of the season average price reveals how far away from that average prices were in any year (Figure X).
Figure 10. Adjusted SAP
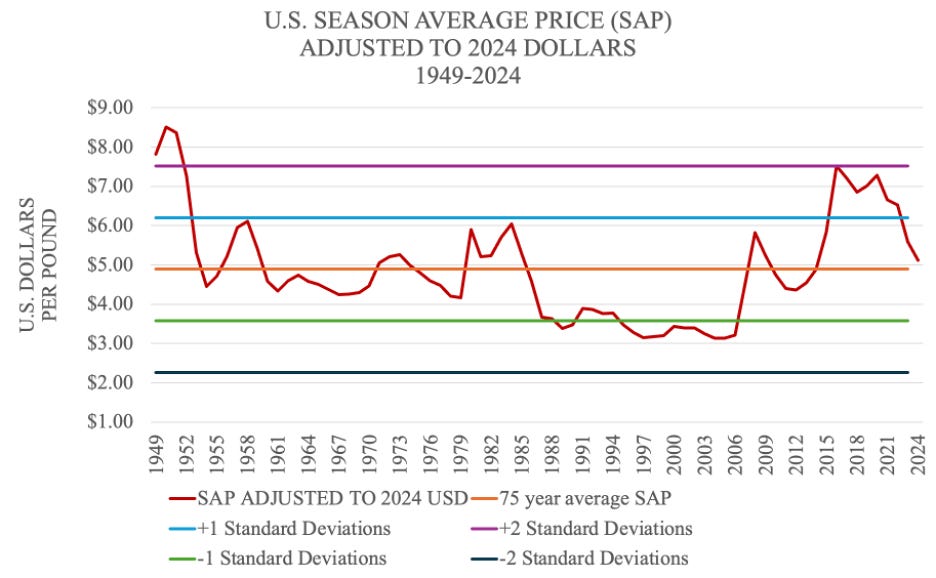
SOURCE: USDA NASS, U.S Bureau of Labor & Statistics
Between 1986 and 2006, the extreme surplus of alpha acid caused by the production of new high alpha yielding varieties without corresponding acreage reduction combined with farmers’ pursuit of growth and consolidation created an alpha surplus. The thinking, as one farmer put it, was that he could “lose less per pound by producing more.” [4] In a completely unregulated market, farmers produced on speculation. Without branded products, they could only compete on price to gain market share. Flush with money from the boom in the early 1980s, they gambled farm equity to fight each other. As a result, prices plummeted far below the long-term average and stayed there.
In the most recent boom, monopolistic control over proprietary varieties added a new dimension of control to the cycle, the perception of sustained artificial scarcity. This, combined with forced long-term contracts and the insatiable desire by American craft brewers for new hop varieties enabled prices to soar. Prices remained at premium levels longer than any period since World War II.
The proper term for this pressure is “Reversion to the Mean”[5]. This Forbes article explains the concept. It’s simple really. The farther away prices move from the long-term average (in either direction) the more likely they are to correct in the next period. It is as if pressure for a correction builds the farther price move away from long-term average prices. Once the pressure becomes stronger than the forces causing prices to be so far from the long-term average, it triggers a reaction. I explained this in greater detail in my January 2023 article entitled “2023 Hop Forecast”. Using previous hop boom and bust cycles for reference, we can infer that season average prices will continue to decline in 2025.
Although these are American prices, the hop industry is global, and the markets are related. The boom and bust cycles are shared by all. What happens in the U.S. affects hop prices in every corner of the globe.
END OF PART ONE
Stay tuned for the exciting conclusion in PART TWO … and much more!
The U.S. Hop Industry Profit & Loss Statement
Market Concentration
The Delayed Surplus Response (DSR)
Depletion Rates
Stocks
The U.S. Trade Balance
German industry data
Inflation
Global beer production & hop usage
Conclusion
Forecast for the future
[1] https://brewingindustryguide.com/rightsizing-the-hop-market/
[2] USDA NASS National Hop Report 2012-2021
[3] According to USDA NASS reported data. Due to the criteria for listing a variety separately, there are many proprietary varieties that fall in the “Other” and “Experimental” category. I estimate at least half of that catch-all category are proprietary varieties. These breakdowns by ownership do not count those varieties.
[4] This comes from the testimony of Mike Smith at the 2003 Federal Marketing Order hearings held in Yakima, Washington. Transcripts from these meetings are available upon request from the USDA.
[5] https://mathworld.wolfram.com/ReversiontotheMean.html