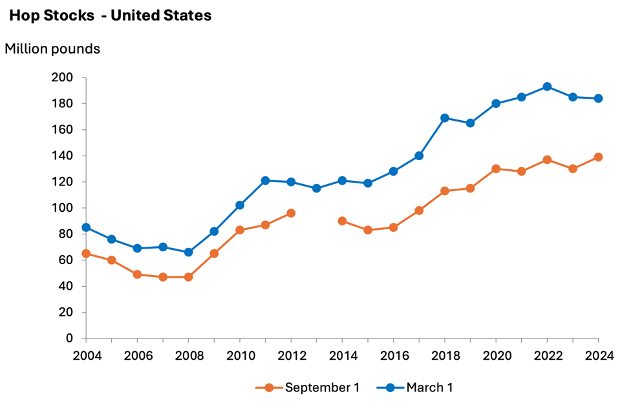
The graph the USDA publishes in their Hop Stocks report reveals very little (Figures 1 & 2). There is, however, plenty of useful information buried in the report.
Figure 1. USDA March and September Hop Stocks Report data graph as presented by the USDA
Source: USDA NASS[1]
Figure 2. USDA March and September Hop Stocks Report data table as presented by the USDA
Source: USDA NASS[2]
WHAT DO THE NUMBERS MEAN?
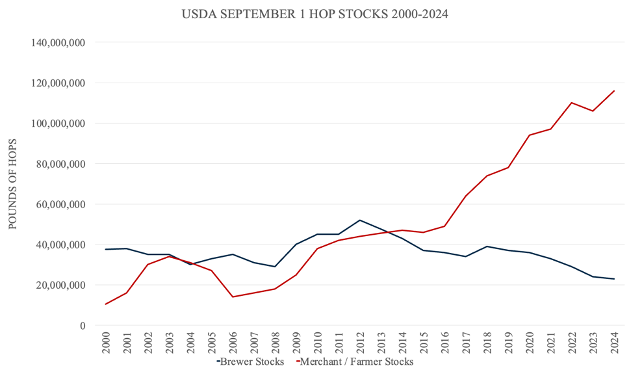
In 2023, the growth in merchant/farmer inventory slowed. The 2023 September 1 hop stocks data created the impression that acreage cuts were correcting the surplus. The 2024 September 1 Hop Stocks report data, when analyzed in detail, reveal that merchant/farmer inventory soared to record highs while brewery inventory continued to decrease (Figure 3).
Figure 3. Inventory held by brewers vs. merchant/farmers
Source: Prepared using USDA NASS data
If you read the MacKinnon Report, you understand that a few powerful people control most of the proprietary varieties. The same people control the largest hop merchant companies in the world. Their power enables them to influence, supply, farmer contracts, brewery contracts and global distribution. They exercised that power first by forcing brewers into five-year contracts. Another example of their flexing that power was in correcting the surplus by restricting supply in 2023 and 2024 while keeping prices from crashing. That was unprecedented in the history of the industry. They have the power to force all but the largest breweries to fulfill their contracts. Brewers fear not getting the varieties they want more than they loath high prices. They won’t risk offending their suppliers, so they do as they are told. A merchant can feel when he has the upper hand over a brewer. Considering the money flows from the brewing industry, it appears the tail is wagging the dog. According to the Federal Reserve’s definition, it’s a great example of an oligopoly dominated by a few large companies[3].
Despite all that power, the market found itself once again in what appears to be the hop cycle. This is not your father’s hop cycle. Everybody got a little excited by the billions of dollars flowing into the hop industry between 2012 and 2022. Mistakes were made. Five-year contracts continued far beyond the point where they were justified. I can attest to the fact that it’s hard to say no when a brewer is begging to sign a contract at stupid prices.
For the IP owners, this was their first time trying to manage supply using their new power. One of my favorite sayings in Russian is, “Первый блин комом” (the first pancake always has lumps). It means you can’t expect things to go right on the first try. They’ll do better next time. That should scare brewers more than the idea of not getting the trendy new proprietary variety, but in 2024 they don’t seem to care.
The guys who own the IP will get another chance to hone their tactics. They alone are guaranteed a seat at the table in the future. Everybody else’s future is uncertain. There are three challenges they must overcome.
With one crop per year, there is one chance each year to adjust supply.
The industry decision-makers own hop farms in addition to their merchant companies, IP and in some cases breweries. That farmer bias influenced their decisions. The last thing a hop farmer wants to do is remove trellis. History shows an extreme market event (i.e., 2007-2008 & 2012-2022) is necessary to rebuild. An outsider may think high prices are a dream come true for farmers. The truth is high prices wreak havoc and lead to irrational decisions that create years of imbalances. There is plenty of incentive to keep that from happening. It seems to avoid such a price spike industry power brokers tried to engineer a soft landing (i.e., to match supply to demand). They must overcome their farmer bias. There are two options. I alluded to these during my recent discussion on the Modern Brewer podcast with Chris Lewington, but I will discuss it in more detail in a bit.
During their attempt to ease into equilibrium, brewer demand decreased. Now they have no idea where demand is … if they ever knew to begin with. They will need to identify demand and focus on producing a deficit that is large enough to maintain premium prices but small enough to keep the market from panicking.
EXPORTS/IMPORTS
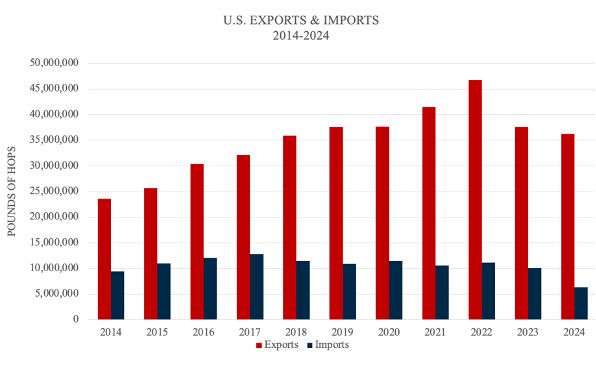
The reason for the surge in merchant/farmer inventory is likely the global trend toward lower hopping rates and decreased beer consumption. According to the 2023 Hop Growers of America (HGA) Statistical Report, U.S. exports in 2023 decreased 9.1 million pounds (4,152 mt) from 2022[4][5]. According to the U.S. Census Bureau, which offers current, exports Between September 2023 and July 2024 were down 3.6 million pounds lower year on year. August data was not available at the time of this writing[6]. Last year’s August data was 2.3 million pounds. If we use that as a placeholder until a new number is reported, exports for 2023-2024 will be 36.2 million pounds (16,420.2 mt) 1.3 million pounds (589.7 mt) lower than the previous year. Declining exports are a result of decreased demand overseas. You don’t move hops around the planet if you don’t need to. I doubt the lower demand for American hops is due to recent EU pesticide regulations causing a bottleneck in hops going into Europe, which members of the International Hop Growers Convention (IHGC) claimed would cost the industry €100 million[7]. I question the accuracy of that number[8]. The affected hops will need to be replaced, that’s true, but the hops in question will not be destroyed. If anybody incurs losses, they will likely be additional shipping expenses for hops to parts of the world for which they were not intended and the price difference between fresh crop and aged product. I covered the European pesticide situation in my March 2024 article, “Pesticides, Hop Stocks and Germany's Growing Problem”.
Back to the numbers. The Census Bureau reported that imports of foreign hops in between September 2023 and July 2024 decreased by 3.7 million pounds[9]. Again, that data does not include August. In August 2023, however, there were no imports. We will assume that will also be the case in 2024 (Figure 4).
Figure 4. U.S. Hop Exports and Imports 2014-2024
Source: Prepared from Hop Growers of America Statistical Report and U.S. Census Bureau data
DEPLETION
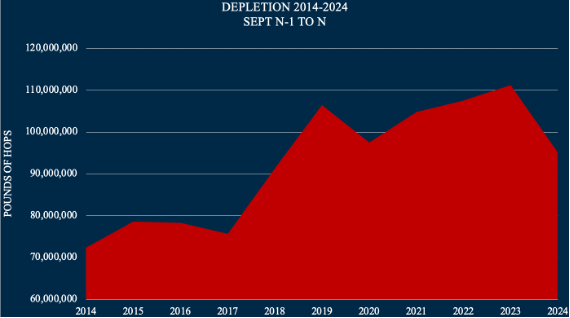
The difference in depletion between 2023 and 2024 was 16 million pounds of hops (Figure 5)[10]. To give perspective to the situation, depletion between 2023/2024 was lower than 2019/2020 when Covid forced the closure of bars and taprooms around the world.
Figure 5. U.S. Hop Depletion 2014-2024
Source: Prepared using USDA NASS data
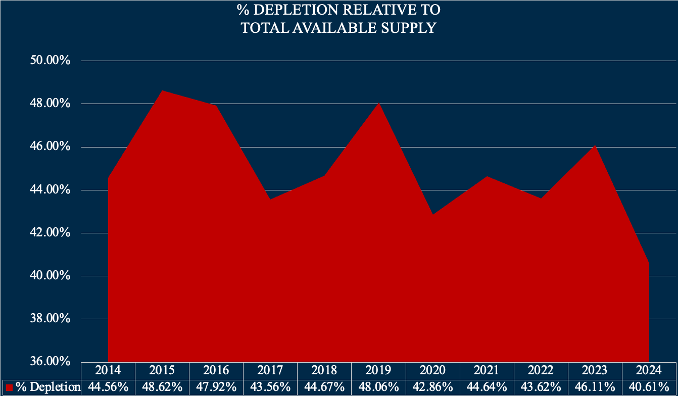
That means the moderate decline in exports during the past 12 months alone do not account for what is happening. If that were the case, we would look at figure 5 (above) and interpret years 2017 through 2022 as producing a deficit of hops. That’s not true. During a deficit, we should expect depletion to increase as a percentage of available crop. It is not enough to measure real numbers as depicted in figure 5 above because the size of the crop grew during that time. Measuring the percent depletion of available crop paints a more accurate picture. The percent depletion considers the depletion figure relative to the total available supply[11] (Figure 6).
Figure 6. Percent depletion of U.S. crop 2014-2024
Source: Derived from USDA NASS statistics
If demand is stable and supply decreases, we can expect the percentage of depletion to increase as surplus inventory moved into the market. During a surplus situation, we can expect the percentage to decrease as less inventory moves. Measuring the percent of depletion is an excellent way to monitor the surplus/deficit situation.
Don’t Forget:
Brewers will hear they need to contract going forward despite the surplus to help merchant/farmers. Without contracts, merchant/farmers will say they don’t know how much to produce. They should not forget the current surplus born from the contracting tactics from the old paradigm that told them how much to produce. Traditional contracting tactics created the surplus. The coming hopocalypse was born from a reluctance to change. It may be out of merchant/farmer control considering the level of financing most American farms have that allows them to produce beyond their means. That is the real reason for the push for contracts. Don’t let anybody tell you any different. The sad thing the coming consolidation of power will bring is the disappearance of independent hop farmers and merchants. Unless brewers begin to purchase more public varieties, they will be driven from the industry.
WHERE IS DEMAND
The difference in depletion between 2023 and 2024 in figure 6 (above) was 5.5 percent. Based on the total available supply for the previous 12 months of 234 million pounds (106,141 mt), that percent decline represents a decline of 12.8 million pounds (5,806 mt) fewer hops moving out of inventory than during the previous 12-month period. That is a good indication of the degree to which demand has decreased.
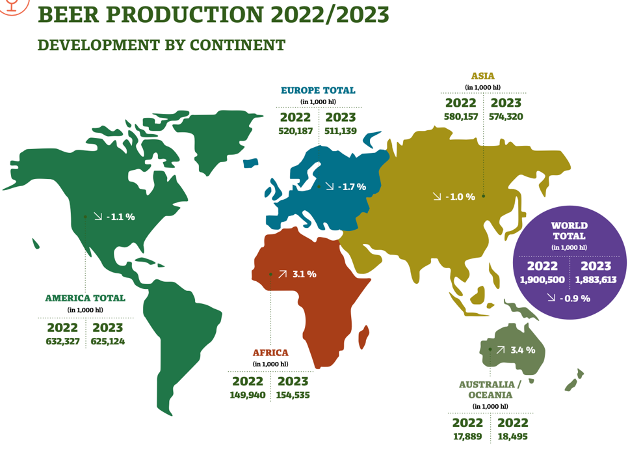
The 2023/2024 Barthhaas Report documented a decrease global beer production of 16,887,000 hl between 2022 and 2023 (Figure 7). Considering a hopping rate of 5.68 g/hl, that would result in a decrease of 95.9 mt of alpha. Based on reported yield data for German Herkules from the same report, that equates to 274 hectares (676.8 acres)[12][13].
Figure 7. Barthhaas global beer production estimates for 2022 and 2023
Source: 2023/2024 Barthhaas Report
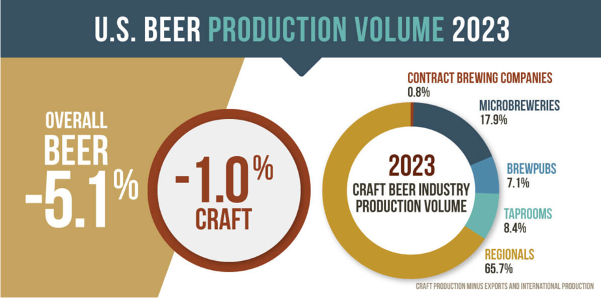
Between 2019 and 2023, U.S. craft beer production decreased from 26.27 million barrels (30,8 million hectoliters (mil. hl.) to 23.35 million barrels (27.4 mil. hl.), a decrease of 2.9 million barrels (3.4 mil. hl.) (Figure 8). At an average hopping rate of a conservative 1.5 pounds of hops per barrel, that represents 4.35 million pounds (1,973 mt) of hops[14].
Figure 8. Brewers Association craft beer production estimates for 2023
Source: Brewers Association
The hopping rate has continued to decrease[15][16]. At the moment, nobody seems to know where demand is. The industry has been so far off target, it will take time to reacquire reality. The soft-landing strategy prolonged the problem. If the decision-makers were not blinded by their farmer bias, they would realize a fast overcorrection would fix the surplus. They would try instead to create a soft take off on the other side of the deficit they create.
If you’ve made it this far in the article, you must have found some value in it. If so, I would appreciate it if you could subscribe if you haven’t already.
If you’re already a subscriber, please consider sharing it with somebody who might also find it valuable.
WHAT TO EXPECT IN 2025
The next 12 months will bring the first signs of the acreage reductions that began in 2022. When added to the 139 million pounds (63,050 mt) in inventory in the U.S. before harvest, the 84 million pounds (38,102 mt) harvested in 2024 reveals that there will be 223 million pounds (101,152 mt) of hops available[17]. The good news … yes, there is good news! That continues the decline in total available inventory that peaked in 2022 at 245.6 million pounds (111,403 mt). The 2024 acreage cuts will make a difference. They bring the industry closer to balance. The bad news … the hard part comes next.
It appears the industry cut enough acreage to bring annual production close to the annual movement of hops (perceived as consumption). The next acreage cuts will be tough. They will cut below demand to move eat into the surplus. Their size will determine how quick the industry reaches the other side of the surplus. A deficit is necessary to move existing surplus inventory into the market.
During the next few years, the closure of independent merchants, farms and craft breweries combined with decreasing demand will complicate the task of identifying demand. The industry is fortunate to know the general direction it’s moving. The removal of an additional 5,000-10,000 acres from production in the U.S. in 2025 would create an annual deficit between 10 and 20 million pounds (4,343 - 8,686 mt). Barring any crop failures in the next few years, that would eliminate the surplus sometime between 2027 and 2030. The deeper the cuts, the sooner the industry reaches the other side.
The net number of acres reduced going forward won’t be so important though. What that number is made of will matter more. The next few years will be turbulent. American farmers will offer aggressive pricing to avoid removing trellis and to avoid going out of business. Some aroma acreage reductions will be offset by alpha acreage plantings. That will force the removal of alpha acreage in Germany (i.e., the next front). I discussed this in my November 2023 article, “A silent hop crisis is brewing”.
HOP CYCLE
Cutting deeper than the annual supply/demand balance sounds extreme, I agree. It’s no more extreme however than producing more than the market needs year after year. When the industry is overproducing, prices are good. Everybody thinks they can afford a few small mistakes. Those mistakes accumulate over time. In the past, the market regulated the process. Nobody knew where demand was then either. This is nothing new. In the past, by the time a deficit appeared, farmers, starving for revenue forced contracts and planted unregulated public varieties causing a surplus sending prices plummeting.
For decades, hop merchant/farmers dreamt of controlling supply. If they could do that, they believed they could manage the hop market. Life would be good. Today, they have that power and must learn how to wield it.
“Be careful what you wish for; your wish may be granted.”
- Aesop’s – The heardsman and the lost bull
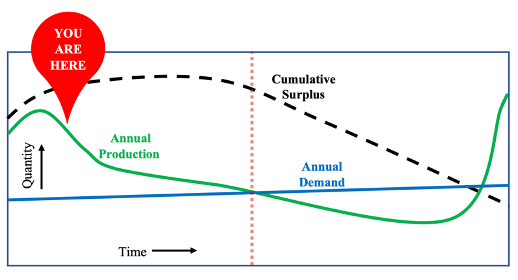
For those who haven’t lived through a hop cycle yet, I explained how it works in my February 2023 article, “The truth behind the hop surplus” (Figure 9).
Figure 9. Lifecycle of a hop surplus/deficit
Nineteen months have passed since I wrote that article. Today, the “YOU ARE HERE” bubble is closer to the dotted red vertical line and annual demand is declining.
“The thing that hath been, it is that which shall be; and that which is done is that which shall be done: and there is no new thing under the sun.”
- Ecclesiastes 1:9
THE SOLUTION?
There is something different this time. On the other side of the surplus there lies the potential for a strictly regulated supply of aroma hops in a mature market with premium prices. This is due to the disproportionate amount of proprietary varieties in the world today. To get there, the industry must endure the most difficult part of the contraction. What remains to be seen is how an industry with the infrastructure to service over 60,000 acres will be efficient with one third fewer acres. This too is nothing new. It happened in the hop industry between 1996 and 2004. Those were desperate times for many.
In the past, by the end of the surplus portion of the cycle, the absence of idle trellis made expansion expensive. It sense to manage the reentry rather than the decline. The industry being unprepared for the reentry is what causes prices to skyrocket. If idle trellis remains available to facilitate the inevitable acreage increases in 2027 and beyond, reentry into the market will be smoother and prices will not spike. It costs money to maintain idle acreage. The people whose responsibility it is to manage the decline have royalty money they could use to subsidize idle trellis. That would facilitate a softer acreage expansion on the other side of the deficit, which would be for the good of the industry.
With all the focus on the surplus of aroma varieties, an old familiar friend of the hop industry has been lurking in the shadows waiting to rear its head. If industry leaders get the aroma market under control between now and 2030, it appears the world is gearing up for a good old fashioned alpha battle. Every year I have worked with hop farmers and merchants, I’ve heard people say, “this year is going to be interesting”. Whatever the supply situation in the coming years, there will be no shortage of “interesting” times ahead.
[1]https://www.nass.usda.gov/Statistics_by_State/Regional_Office/Northwest/includes/Publications/Hops/2024/hops0924.pdf
[2]https://www.nass.usda.gov/Statistics_by_State/Regional_Office/Northwest/includes/Publications/Hops/2024/hops0924.pdf
[3] https://www.stlouisfed.org/open-vault/2023/may/what-makes-a-market-an-oligopoly
[4] https://www.usahops.org/img/blog_pdf/474.pdf
[5] In its statistical report, HGA reports exports from September (year n-1) through August (year n).
[6] https://usatrade.census.gov/index.php?do=login
[7] https://www.ihgc.org/wp-content/uploads/IHGC_Statement_DG-SANTE_Bifenazate-MRL_2024.pdf
[8] I know of at least one hop farmer who either doesn’t understand the idea of mitigated damages or lacks the moral compass to report them honestly. With that in mind, I suspect this was an exaggeration designed to get attention and increase the perceived significance of the regulation change.
[9] decreased by 1.1 million pounds (522 mt) between 2022 and 2023.
[10] This means 16 million fewer pounds of hops were withdrawn from U.S. warehouses between September 2023 and 2024 than were withdrawn between September 2022 and 2023.
[11] Total available supply is comprised of the previous September 1 hop stocks and the previous year’s crop before they are affected by imports and exports.
[12] https://www.barthhaas.com/resources/barthhaas-report
[13] Based on time of harvest estimates
[14] https://americanhopconvention.org/assets/img/misc/Brewer-Panel-Bart-Watson.pdf
[15] https://www.brewersassociation.org/statistics-and-data/national-beer-stats/
[16] https://www.brewbound.com/news/bart-watson-us-hop-supply-unsustainable-brewers-need-to-be-prepared-for-market-to-correct-itself
[17] Before exports and imports between September 2024 – August 2025

