THINKING OUT LOUD
Again, there was a lot of hop-related news to cover over the past week. So much news in the hop industry in March is unusual. Future issues will have analysis of a wider variety of topics, I promise. There has been a story developing about pesticide regulation and the EU. This week things started to get exciting. I received a copy of an email sent out by one hop merchant to their customers explaining what the new regulation would mean and how it would impact their service. In it, they said they would continue to deliver conforming lots, but they may not be from the contracted crop year.
If I was a European brewer who didn’t need my contracted hops, I would review my contract with my lawyer to see if changing MRLs or government regulations were covered in the Force Majeure section or somewhere else in my contract. I don’t believe either party is allowed to unilaterally change the terms of a contract. During Covid, American farmers expanded acreage in 2020 and 2021 despite claims to the contrary[1][2][3]. Breweries weren’t allowed to alter their contracts. Pandemics were not considered a Force Majeure event. In the current market, another merchant might be happy to make a great deal with better terms.
In this edition of the MacKinnon Report, I’ll discuss two of the pesticides slated for stricter regulation in the EU, the potential consequences, and the hop industry’s attempts to lobby the EU to change their mind. Of course, I’ll provide my analysis of the situation to put it into perspective (See Pesticide Regulation below).
I’ll break down the March 1 hop stocks report to show why this is one of the most important statistics of the year and how it hints at supply, demand and the size of the surplus. (See March 1 Hop Stocks below)
I’ll also discuss the reason why Germany and much of Europe will have trouble remaining competitive producers in the coming years. (See Germany’s Growing Problem below)
Pesticide Regulation
Hop farmers use quite a few pesticides to receive the high yields that have become the norm. The industry battles constantly changing regulations. The US Hop Industry Plant Protection Committee (USHIPPC) unites hop farmers from countries around the globe to maintain a comprehensive list of the chemicals that can be used for various purposes and at which levels[4]. In the past year, several pesticides have attracted the attention of the EU. Two pesticides used on hops in the U.S. have being targeted for stricter regulation. Others are being considered that would affect European hop producers. For this edition of the MacKinnon Report, Etoxazole and Bifenazate are the two pesticides we will discuss. The changes to the MRLs for these chemicals would affect the sale of U.S. hops into the EU. The estimates of the damages will surprise you. The story is a bit different than how it has been presented.
Etoxazole
On September 15, 2023, the European Union published regulation (EU) 2023/1783[5]. The new regulation reduced the maximum residue levels (MRL) for five pesticides used on various crops. One of those pesticides, Etoxazole, is an insecticide used to control spider mites in hops[6]. Its MRL was reduced from 15 parts per million (ppm) to 0.05 ppm[7][8]. Perhaps this article about the toxicity of Etoxazole published in Nature in November 2022 had something to do with the stricter regulation[9].
The new law becomes effective on April 8, 2024. After that, hops with residues of Etoxazole over 0.05 ppm cannot be used or sold in the European Union. A list of acceptable MRLs by country for Etoxazole and other pesticides used on hops is available on the website of the US Hop Industry Plant Protection Committee (USHIPPC)[10]. It reveals several countries to which hops exceeding the MRLs for Etoxazole may be sent.
Bifenazate
Pending regulation of Bifenazate in the EU seems to be another serious problem for the American hop industry. At the time of this writing, the EU has not changed the MRL for Bifenazate. They are scheduled to decide on the new regulation at the end of March. If they approve the proposed change, the new MRL will go into effect in September 2024. The International Hop Growers Convention (IHGC) requested the Directorate-General for Health & Food Safety of the EU reconsider the change. They claim the change would cause hops from crop year 2022 and older to be illegal, which would result in more than €100 million in damages to the hop industry. They also added that the brewing industry would also suffer due to not being able to secure the hops they need[11].
Channels of trade
Farmers never like to lose the option to use effective pesticides. The issue with both regulations, however, is the absence of the phrase “channels of trade”. According to the U.S. Food and Drug Administration, the inclusion of the term “channels of trade” in proposed regulations means that any product in circulation prior to the passage of the new law is exempt (i.e., a change in regulation would apply to product produced afterward)[12]. The proposed EU changes do not include the clause. In a demanding submission regarding Specific Trade Concern 448 by The United States before the World Trade Organization in 2021[13], the U.S. delegation argued that the EU should include the term “channels of trade” in the regulation of the pesticide chemicals in question. They highlighted that the EU process of enforcing reduced MRLs at the date of importation rather than the date of production created inefficiencies and disruptions in trade. They suggested that including the channels of trade clause would be the least restrictive path forward. This and related STCs continue to be debated before the WTO[14].
Analysis
The retroactive nature of the new regulations creates difficulty for merchants trying to sell older American hop products into the EU. This is not an issue isolated to hops. Since hops may be stored for five to ten years without the loss of any quality, there is more vulnerable inventory in stock. Nor is it a new practice for the EU. Stricter pesticide regulation is part of the EU Farm to Fork Strategy, a primary component of the European Green Deal[15]. One European Green Deal goal was to halve the usage of pesticides by 2030[16]. Farmer protests earlier this year led to an apparent victory for farmers (I will discuss European farmer protests in a future report)[17][18].
The IHGC suggesting that lower MRL on Bifenazate will create a €100 million loss for the industry seems to me like an exaggeration designed to increase the alleged significance of the issue. Considering that regulation will not be implemented until September 2024 at the soonest, damages can be mitigated by producing the 2024 crop in accordance with anticipated MRLs. It will be inconvenient, but it’s not a disaster. Hops once destined for the EU, or already located in the EU that are now forbidden are still usable in countries adhering to Codex MRLs, which is 15ppm[19][20]. The additional shipping cost to send those hops to a country where they may be sold represents the loss a merchant would incur. There is plenty of demand for hops outside of the EU. In 2022, the most recent year for which we have data, the EU produced 313.3 million hectoliters (197.05 million barrels) of beer in 2022[21]. That’s 17.4% of the 1.8 billion hectoliters (1.13 billion barrels) of beer produced around the globe[22].
It makes no sense for the IHGC to claim expected losses equal to the total value of the hops [23]. I have seen members of the industry exaggerate damage claims to inflate their influence. It’s disingenuous. This is not the first time a new MRL was applied retroactively by the EU. A merchant supplying breweries or storing large quantities of American hops in the region should have known the risk. The main problem, in my opinion, is not changing MRLs, or even the retroactive nature of the changes. The issue is that tens of millions of pounds (thousands of metric tons) of hops from crop year 2022 and earlier remain in storage in 2024. Suggesting the total loss of the hops creates the potential for fear among brewers that there might be a shortage of hops … during the largest surplus in the history of the industry. There will undoubtedly be some loss as hops are shipped to alternative markets. If the financial burden of these and other pending MRL changes are too great and some merchants fail, the industry will survive.
“When we are no longer able to change a situation – we are challenged to change ourselves.”
- Viktor E. Frankl
MARCH 1 HOP STOCKS
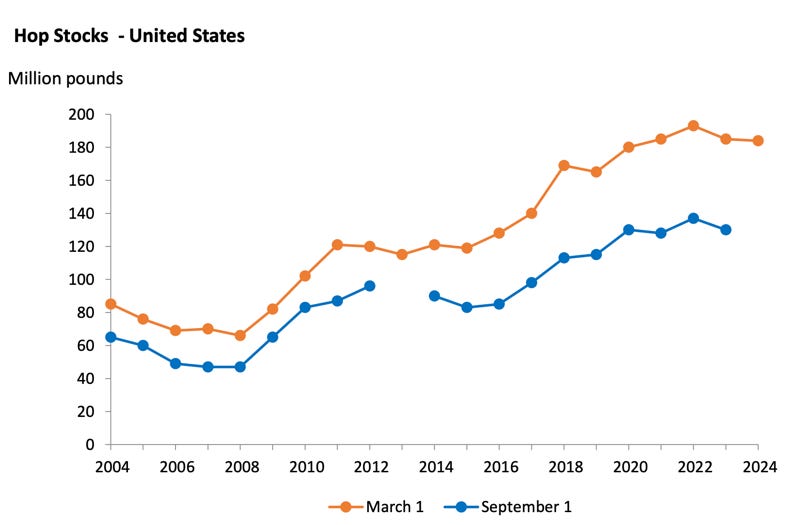
On March 15, 2024, the United States Department of Agriculture, National Agricultural Statistical Service (USDA NASS) released the U.S. hop stocks figure as of March 1[24]. You can download it here and subscribe to receive the reports if you haven’t already. The USDA continues to present the raw data using the same graph they have used for decades (Figure 1).
Figure 1. USDA NASS Hop Stocks Graph
Source: USDA NASS
As I have mentioned in previous articles, this graph tells very little about the state of the industry … even to somebody familiar with industry events. For people whose primary job isn’t deciphering hop industry data, it reveals nothing. The NASS also provides the raw data for the three most recent years in their report, which is a bit more useful (Figure 2).
Figure 2. Raw data from March 1 Hop Stocks report
Source: USDA NASS
Based on my doctoral research, the March 1 and September 1 stocks data reports are two of the most relevant reports for understanding the supply/demand position of the market. To get any value from these reports, a longer time horizon is necessary and some derivative data must be calculated. It is necessary to break down the “total stocks” number into its parts. I will do that below.
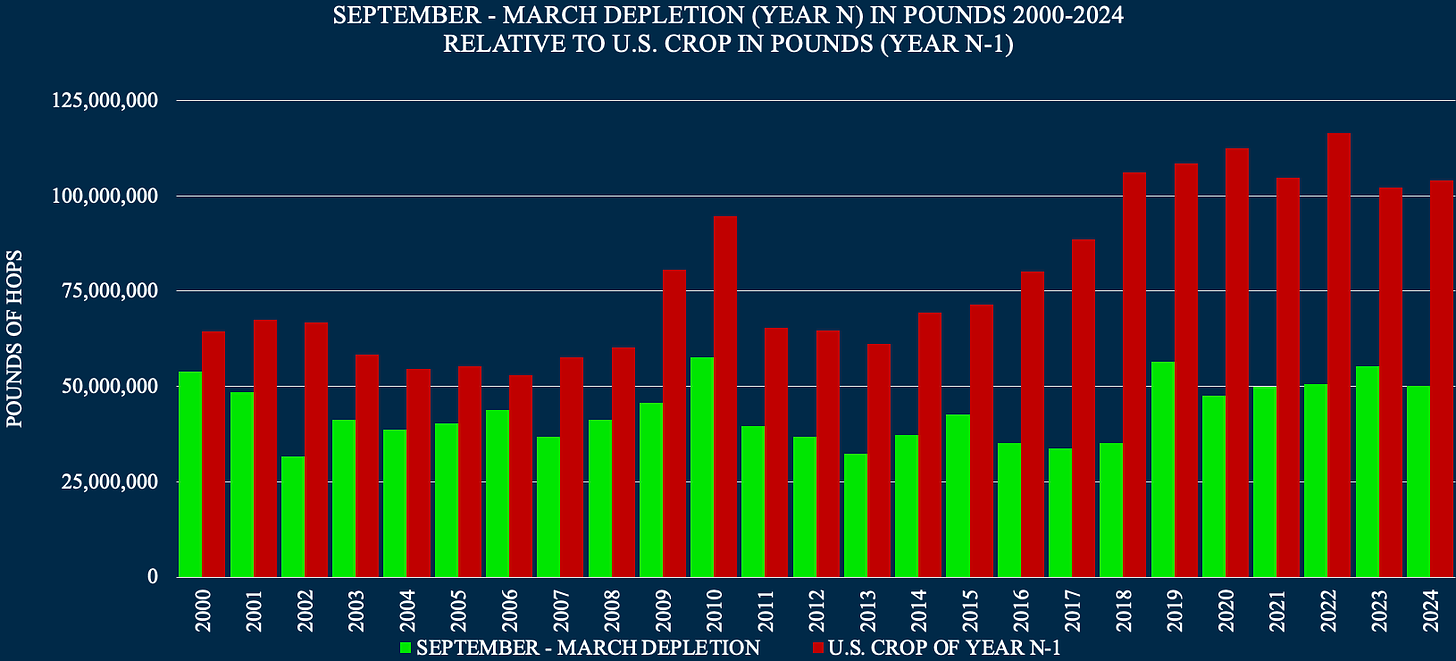
One of the valuable calculations from hop stocks report is depletion (i.e., the quantity of hops that has been delivered from inventory in the previous period). This is often calculated for the period from September 1 of the previous year to September 1 of the current year (Sept-Sept). It can also be calculated for the period between September 1 from the previous year and March 1 (Sept-Mar). Calculating the raw number is revealing when it is placed in the context of historical depletion numbers. It must be placed relative to something, however, to provide the additional context necessary to give it meaning. One way to offer context is to compare the Sept-Mar depletion number to U.S. production (Figure 3).
Figure 3. September to March depletion relative to U.S. production
Source: USDA NASS data 2000-2024
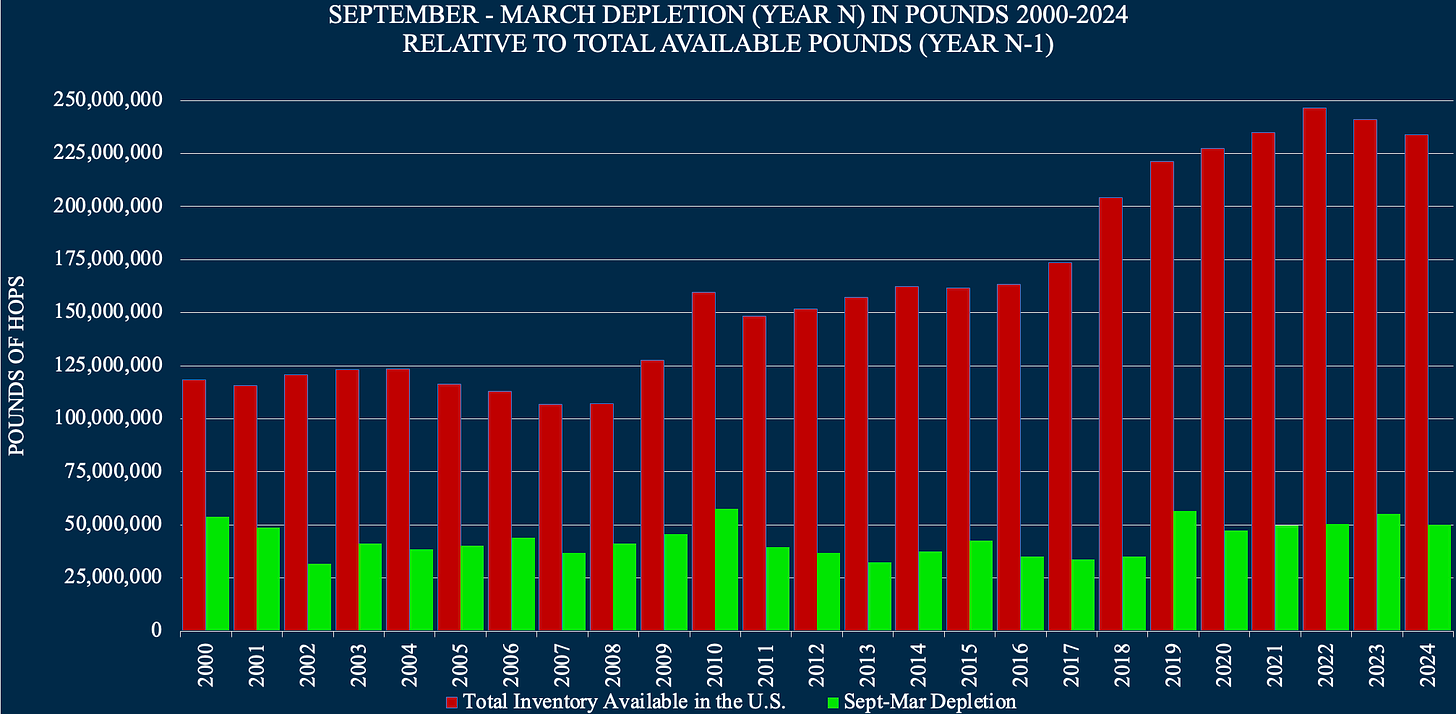
That’s not the best comparison because the hop stocks report contain hops that are imported to the U.S. in addition to U.S. hops. Figure 3 makes represents a growing U.S. production over the years while the depletion number remains stable at lower levels. From that, we might infer growing international demand for U.S. hops. The graph doesn’t tell the whole picture. For that reason, it is more useful to present the Sept-Mar depletion data against the most recent total available inventory figures. That would be the September 1 stocks figure from the previous year combined with the previous year’s crop (Figure 4).
Figure 4. September to March depletion relative to the prior year’s September 1 hop stocks figure plus the prior year’s crop.
Source: USDA NASS data 2000-2024
Figure 4 puts the growing quantity of surplus inventory in a better perspective. It represents American hop crops in storage by the end of harvest 2023.
There’s still more information that can be mined from the hop stocks numbers. The stocks numbers represent U.S. and foreign hops stored in the U.S. from multiple years. The comparison of Sept-Mar depletion year on year can be used to demonstrate relative demand. When graphed over a longer timeline, it becomes obvious that the Sept-Mar depletion rate corresponds to periods of surplus and deficit. There is also a correlation between the depletion rate and changes in price that I will not present here in the interest of keeping this article brief.
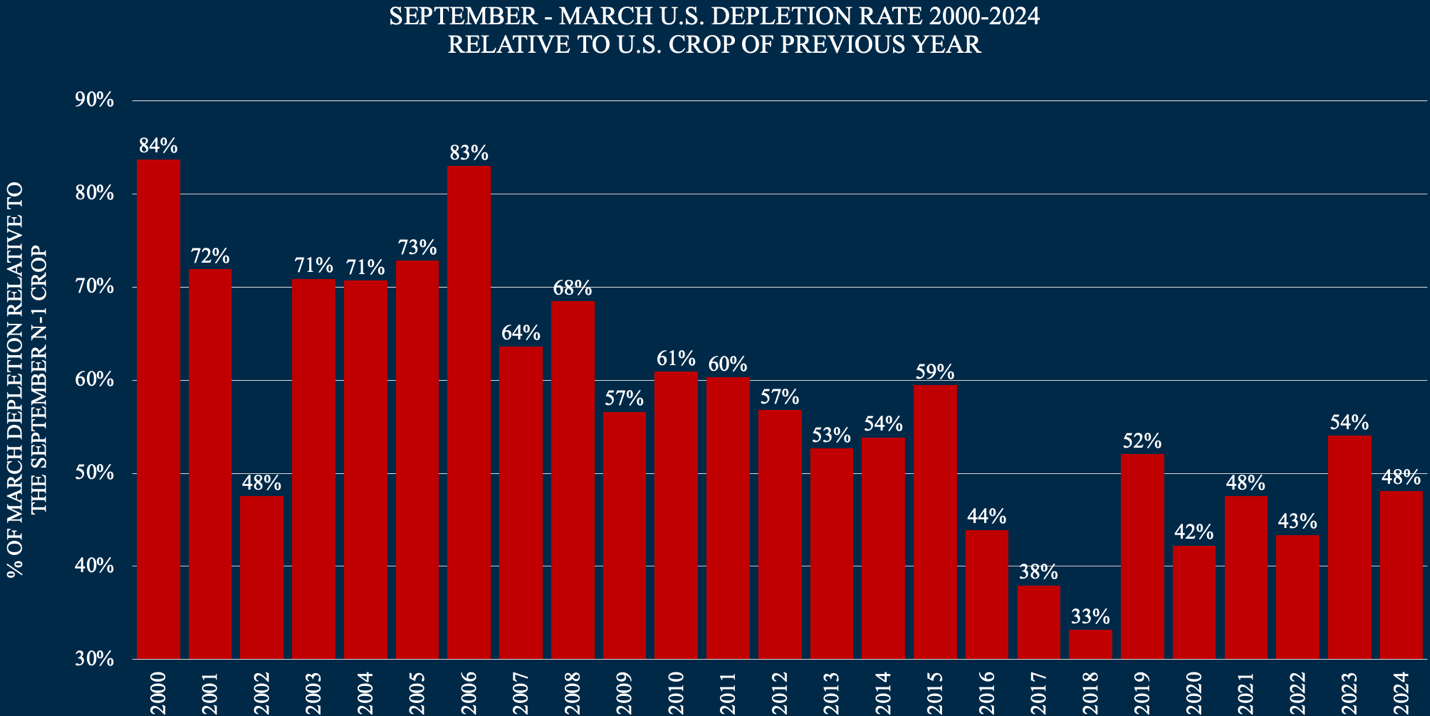
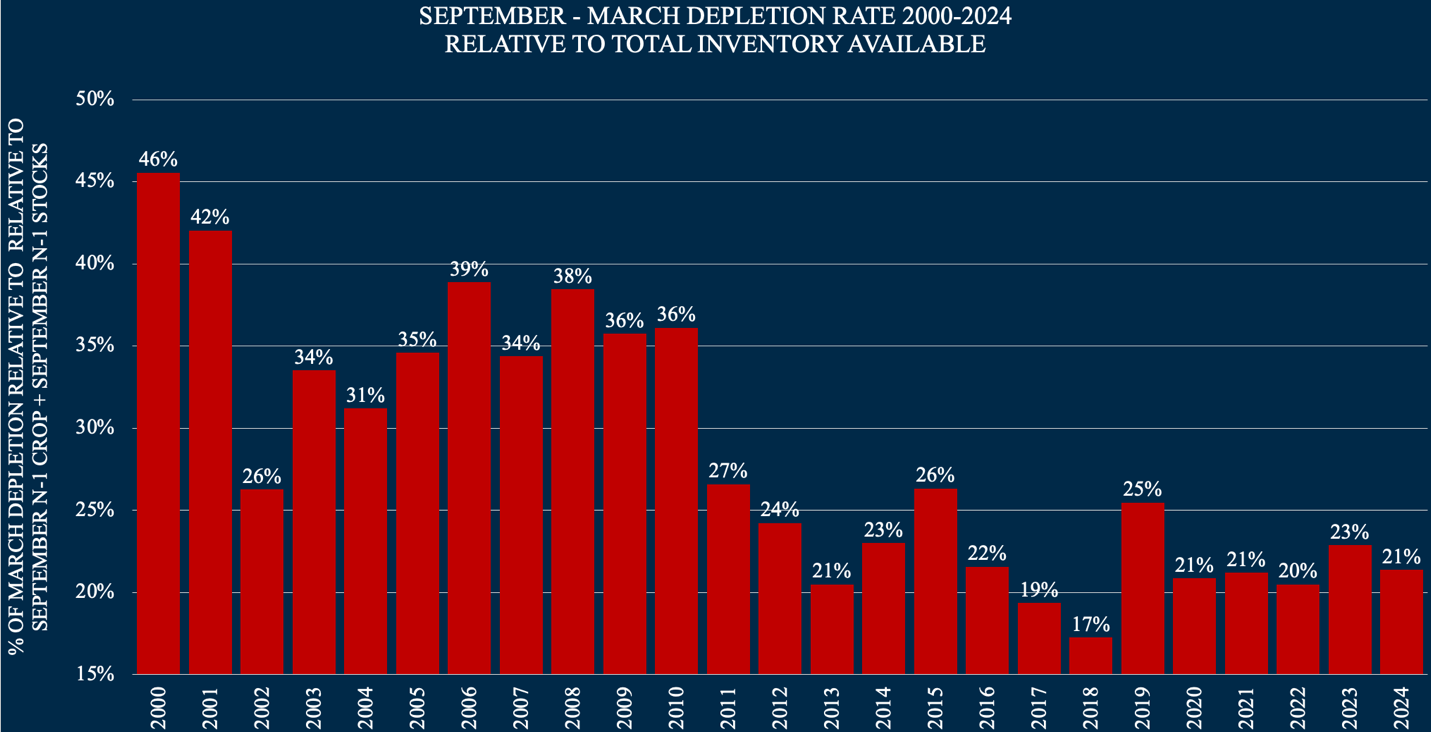
By tracking the percentage of the crop moving during the first six-month period, it is possible to measure hop velocity (the speed with which hops moved out of inventory as soon as they became available). For those who experienced hop industry events since the year 2000, it will be obvious that the percentage of the Sept-Mar depletion relative to the most recent crop (Figure 5) or to total inventory available (Figure 6) is an indicator of the urgency with which brewers took delivery of hops post-harvest. The higher the percentages, the more urgent the need for the current crop[25].
Figure 5. Percent of September to March depletion relative to previous crop
Source: USDA NASS data 2000-2024
Figure 6. Percent of September to March depletion relative to total available inventory
Source: USDA NASS data 2000-2024
I have also measured the correlation between these numbers and the following year’s U.S. season average prices. There is a strong correlation between the two. With more data, it would be possible to predict prices within a narrow range. Please remember that figures five and six are a representation of hop movement over a six-month period. When the September 1 hop stocks is released later this year, I will show the first six-month period of depletion relative to the second six-month depletion (i.e., Mar-Sept) to further demonstrate the supply/demand point I made above. For now, please believe me when I say that the trend is also present in the second six-month period. But the hop stocks figures reveal even more.
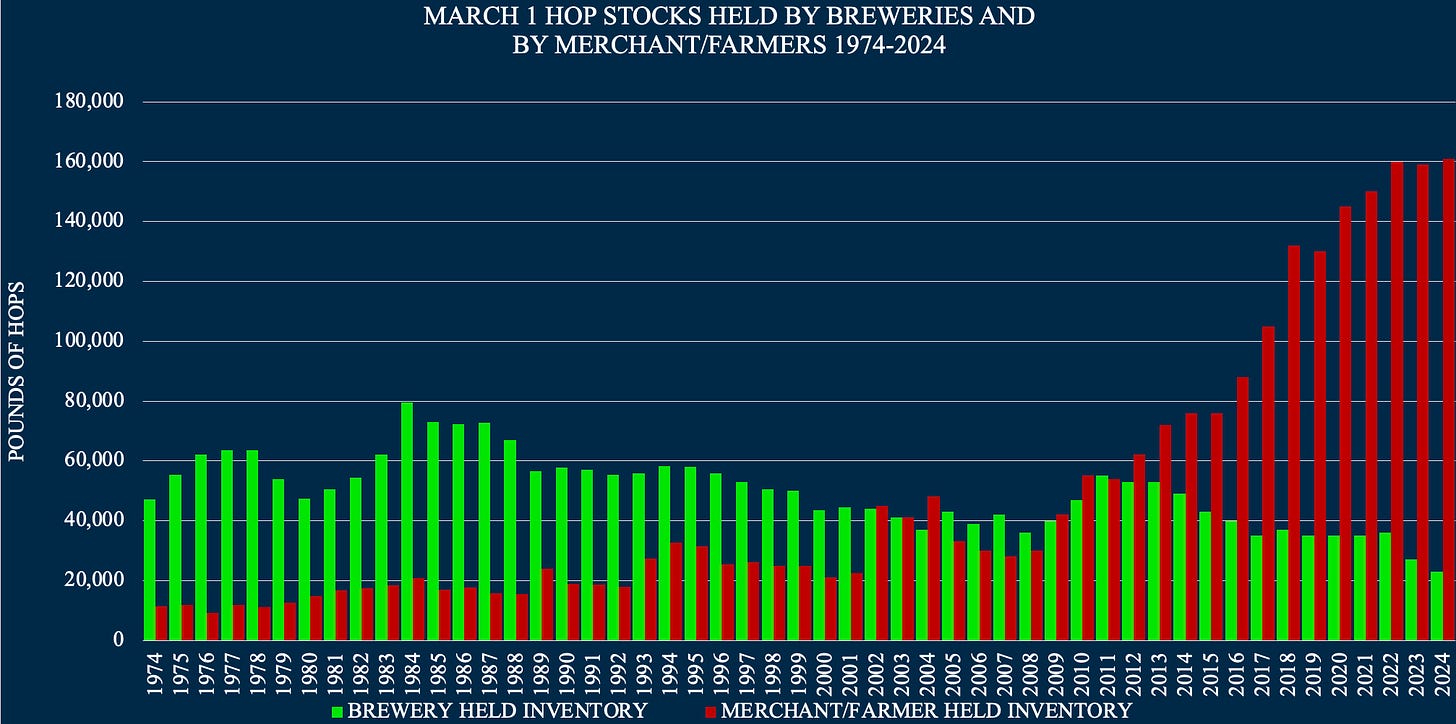
By analyzing the change in the quantity of hops held in brewer hands versus those held in merchant/farmer hands, the numbers reveal where the inventory problems lie. A longer-term historical view of March 1 hop stocks numbers are necessary to demonstrate the magnitude of the shift in inventory possession over time (Figure 7).
Figure 7. March 1 hop stocks broken out by inventory held by brewers and merchant/farmers.
Source: USDA NASS data 2000-2024
Figure seven combined with the data from figure two demonstrates that merchant farmer inventory increased by two million pounds (907.19 metric tons) while brewery held inventory decreased by three million pounds (1,360.79 metric tons). If the goal of the acreage reduction efforts announced by Alex Barth in 2023 was to tighten the supply to encourage breweries to take delivery of a more surplus inventory, the effort failed[26]. Either they miscalculated the severity of the surplus, they knew the actual size of the surplus but were afraid to reveal the true number, or they were blinded by profits and ignored the data. The information was available. In 2018, Louis Gimbel warned farmers at the Hop Growers of America convention about a surplus[27]. He was right. Had they paid more attention to Louis, or had they read the MacKinnon Report, they would have been better informed. I wrote an article in October 2022 discussing the surplus called, “Massive Hop Inventory in the U.S.” In that article, I wrote about the supply problem affecting the industry today.
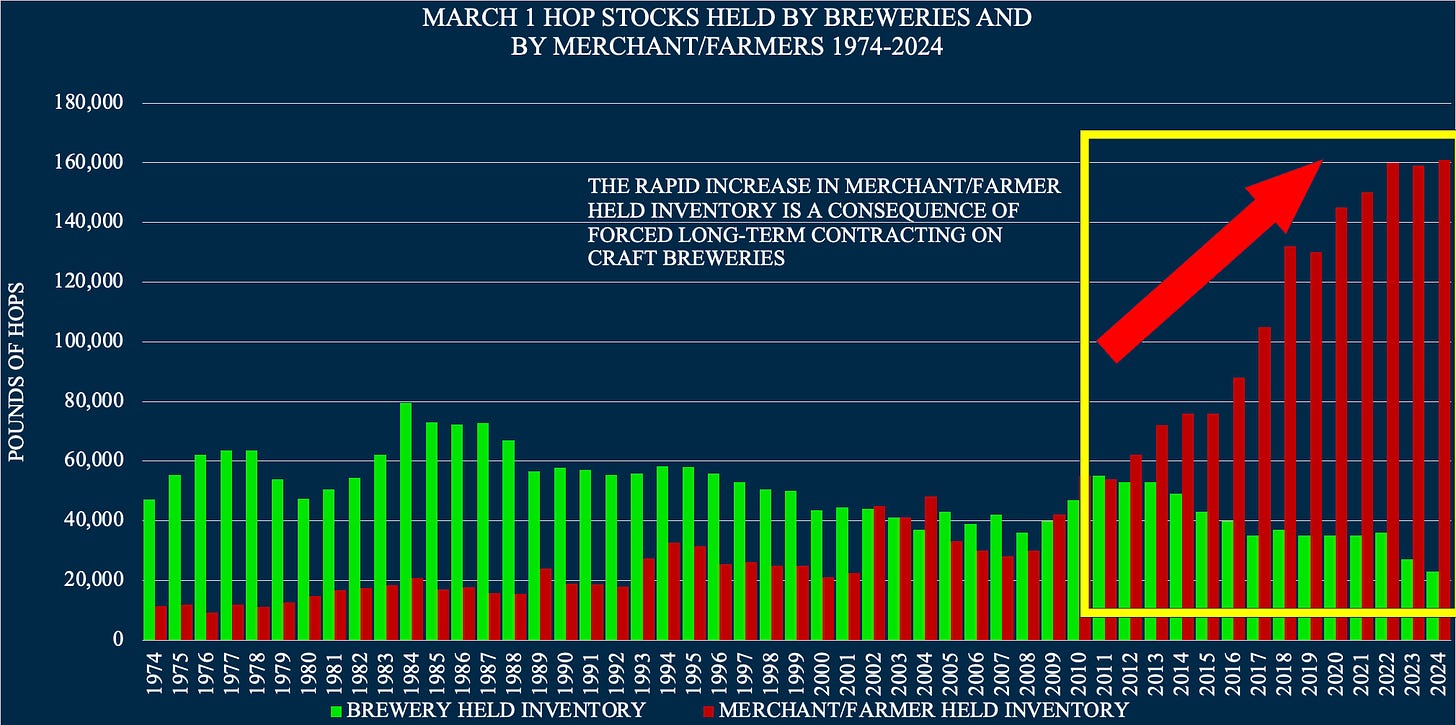
The surplus is far from over in March 2024. In my opinion, the cause is clear. Proprietary variety acreage and the number of craft breweries surged between 2012 and 2022. The contract system forced upon craft brewers by farmers via merchants contributed to the problem. Greed ran rampant through the industry as inexperienced craft brewers continued signing five-year contracts at premium prices. I was a merchant then and fell victim to the greed as much as the rest of the industry. Total inventory held by merchant/farmers soared relative to depletion for over a decade allowing a massive surplus to accumulate (Figure 8). The reduced velocity of hop shipments to breweries should have been a signal something was wrong. Nobody paid attention, or maybe they never realized that hop velocity could be calculated. Regardless the reason … the contracting continued.
Figure 8. March 1 hop stocks by brewery and merchant/farmer with highlighted change
Source: USDA NASS data 2000-2024
A surplus had developed. Between 2012 and 2016 it was manageable. The rapid growth of merchant/farmer held inventory in figure 8 demonstrates that the rate of surplus development accelerated in 2017. The 2023 efforts to reduce acreage slowed the growth of the surplus but did nothing to relieve it. Breweries reported holding fewer hops on March 1, 2024 than any year since the USDA began recording hop stocks in 1947[28].
How many extra millions of pounds of hops (thousands of metric tons) are there in storage around the globe? It’s impossible to give an exact number with the information available today. I have a solution for this that I plan to work on after the 2024 harvest. Until then, there is no way to know.
According to the most recent export numbers available from Hop Growers of America, the U.S. exported 37.6 million pounds (17,055 mt) of hops between September 2022 and August 2023. During this time, the U.S. imported 10 million pounds (4,055 mt) from overseas[29]. A large portion of those shipments occur between September and March to take advantage of cold winter temperatures in the northern hemisphere.
FUN FACT:
The U.S. hop export figure is consistent except for a spike of 1,713.4 mt (3.77 million pounds) reported in 2021 and another of 4,125.3 mt (9.09 million pounds) in 2022[30]. The total of the two spikes was 12.87 million pounds (5,838.7 mt). In 2023, exports returned to normal. The timing of the export spikes coincided with the completion of the construction of the Yakima Chief Hops’™ (YCH) warehouse in Belgium. According to the company’s website, the warehouse holds 8,800 pallets of hops[31]. In the YCH shipping guide, a pallet is shown to hold 600kg (1,320 pounds) of pelted hops. This is for a standard American-size pallet. A Euro pallet is smaller[32] and can hold 400 kilos (880 pounds) of hop pellets. If the warehouse was filled with pelleted hops, it could hold 7.74 million pounds (3,510 mt) of hops. Pallets holding extracted hops, however, could represent 5-10 times as many raw hops depending on their packaging. It is safe to assume YCH sells alpha extract. Considering extract storage, the YCH Belgian warehouse could easily account for the entire 12.87-million-pound (5,838.7 mt) surge in hop exports in 2021-2022. That inventory would not need to be reported on USDA hop stocks figures since it is not located in the U.S.[33]
At the 2023 Hop Growers of America convention, Alex Barth claimed the annual demand for U.S. hops was between 100-105 million pounds (45,359.7 – 47,627.7 mt). During on my doctoral research, I developed a way to measure the demand for hops and predict its effects on future pricing. Based on that, I believe Alex’s estimates were too high by 10-15 percent. The cumulative effect of this miscalculation between 2016 and 2022 would result in tens of millions of pounds of surplus hops. I discussed how large I thought it was in my November 2023 article, “What Hop Merchants Won't Tell You About the Surplus.”
A simplified view of the market suggests that demand for American hops has been closer to 85 million pounds (38,555.7 mt), not 100-105 million pounds (45,359.7 – 47,627.7 mt). If American farmers can reduce production by 10,000 acres in 2024, that will stop the buildup of inventory. The next task will be to reduce inventories. Cuts will be necessary in 2025 to create an opportunity for the mountain of aging hops still sitting in inventory to move into the market, unless those hops are destroyed. Extracting surplus high alpha aroma varieties fixes the problem for proprietary varieties, but it would destroy the alpha market for some time to come. I expect that will happen as the owners of proprietary varieties are desperate to restore order to their assets before their patents expire.
GERMANY’S GROWING PROBLEMS
Germany has been Europe’s industrial powerhouse for decades. Those days may be coming to an end[34]. In response to Covid, the U.S. government authorized up to $659 billion in loans to employers in 2020 and 2021 through the Paycheck Partnership Program (PPP)[35][36]. This provided instant relief. Some American hop farms and merchants received millions of dollars under this program despite high forward contract rates ensured sales and farm workers essential worker status minimized their suffering[37][38]. Loans favored big business and were later forgiven[39][40].The Federal Reserve noted on their website that the funds were not well spent and did not perform as hoped[41].
The European Union (EU) took a different approach. They created the Recovery and Resilience Facility (RRF). They approved €360 billion in loans and €312.5 billion in grants to be dispersed between 2021 and 2026[42]. Rather than focusing on helping businesses survive the crisis, the EU focused on “building back better” following Covid[43]. Because the way European hops are heavily contracted forward, the industry didn’t feel the effect of reduced beer consumption as much as breweries selling to bars and restaurants, which operated at reduced capacity. Halfway through the RRF program, €225 billion of the available €672.5 billion, has been spent[44]. Many fear the potential for a financial crisis as the payments come to an end in 2026[45].
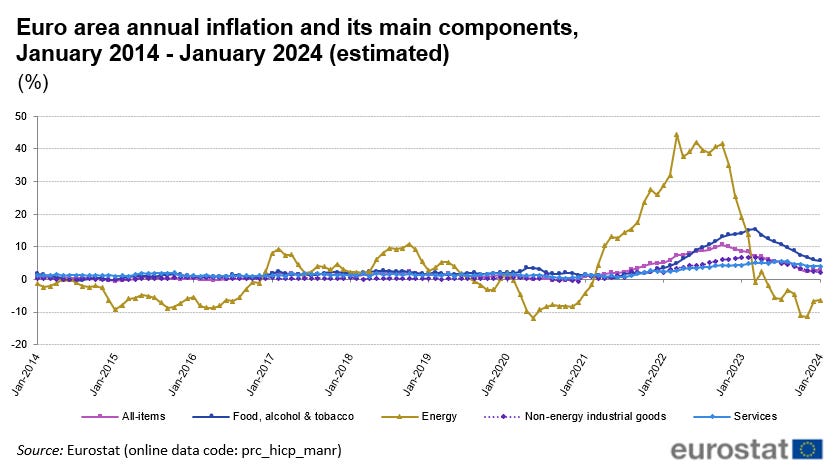
The post-covid recovery in the EU was slow prior to the war in Ukraine[46]. RRF funds have supported the economy[47]. The war is now blamed for poor economy, which has brought high inflation[48] (Figure 9) and greater demands on government funds.
TIME OUT FOR A MESSAGE TO OUR SPONSORS: If you’re reading this part of the report it’s because you are already a paid subscriber. Thank you for subscribing! It means a lot to me. I will work hard to earn your money and provide you value. Later in the year, I will prepare some reports that will be for subscribers at the founding member level only. I think you will find them interesting. For now, I will keep them secret. They will be trip reports to places you may not have visited. I think you will find them interesting and I hope you will consider upgrading your subscription at some point. The first of those reports will be in May. If you are a founding member and have a suggestion for a special report, please let me know.
Figure 9. Euro Area Annual Inflation Rate
Source: Eurostat[49]
The EU sent €88 billion to support Ukraine between 2022 and 2024[50]. Despite strong anti-war statements and anti-Russian sentiment by governments across the EU, Europeans rely on imports of Russian natural gas, grains and petroleum-based fertilizers more in 2024 than ever[51][52][53].
The war has strained European budgets in more ways than one. The United Nations Refugee Agency (UNHCR) estimates 5.98 million Ukrainian refugees have entered EU member states. Germany leads the way[54][55]. Supporting refugees has created an additional financial strain on an already suffering Germany, once considered the industrial powerhouse of the EU[56]. The new financial obligations combined with Germany’s ambition of “net zero budget” brings the country closer to recession and created tensions among farmers[57][58][59].
In 2022, Biden pledged to end the Nord Stream 2 pipeline if Russia invaded Ukraine[60]. Countries that have investigated the sabotage refuse to comment[61][62]. Following the destruction of Nord Stream 2, the U.S. became the largest exporter of Liquid Natural Gas (LNG) to Europe increasing from 5% to 20% of imports[63][64]. The evidence is circumstantial, but the U.S. appears to have had motive, means and opportunity.
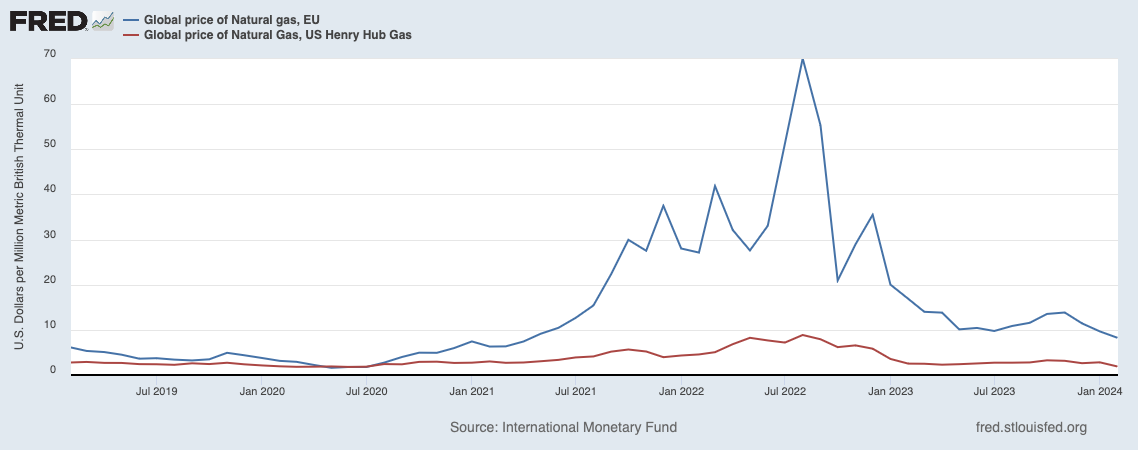
As a result of the destruction of the Nord Stream 2, Russian sanctions and the closure of Germany’s nuclear power plants[65], prices for energy and natural gas increased[66]. Meanwhile, natural gas prices in the U.S. have remained stable (Figure 10).
Figure 10. EU & US natural gas prices
Source: U.S. Federal Reserve of St. Louis
Rising labor costs, high interest rates and bureaucracy have made Germany and the EU less competitive[67][68]. The trifecta of negative economic circumstances does not bode well for European farmers whose costs are rising in a market where prices for some commodities, like hops and barley, are falling[69]. The forecast for the future of the German economy is not optimistic[70]. Farmers are feeling the pain as their profit margins are reduced to nothing. Some European hop farmers have already required intervention and special treatment by their hop merchants to survive. That trend will likely continue as the pain of a difficult economy makes its way to every corner of the union. The European people’s patience with their government is wearing thin. Nationalism is spreading across the continent[71][72][73]. In former Soviet block countries there is tension between ethnic Russians and the native populations where none existed since the fall of communism. Farmers have been the first to reach the breaking point. The protests continue in European capitals as the time for field work approaches. I will write more on that story in a future edition of the MacKinnon Report.
[1] https://www.usahops.org/img/blog_pdf/474.pdf
[2] https://www.yakimaherald.com/news/local/hop-growers-make-changes-adjust-acreage-in-response-to-covid-19-pandemic/article_64c56709-9fca-513f-8b59-73095458b508.html
[3] https://www.goodbeerhunting.com/sightlines/2020/5/15/covid-19-forces-hop-growers-to-confront-new-concerns-over-supply-safety
[4] https://www.usahops.org/growers/plant-protection.html
[5] https://eur-lex.europa.eu/legal-content/EN/TXT/PDF/?uri=CELEX:32023R1783
[6] https://pubchem.ncbi.nlm.nih.gov/compound/Etoxazole
[7]https://www.google.com/url?sa=t&rct=j&q=&esrc=s&source=web&cd=&ved=2ahUKEwiDmdnT6oWFAxVrOkQIHaTnA0AQFnoECA8QAw&url=https%3A%2F%2Fagrinfo.eu%2Fbook-of-reports%2Fmaximum-residue-levels-for-etoxazole%2Fpdf%2F%23%3A~%3Atext%3DThe%2520EU%2520has%2520reduced%2520the%2C)%2520of%25200.01%2520mg%252Fkg.&usg=AOvVaw2xCcpjnugeMun2ARhvIY2j&opi=89978449
[8] https://eur-lex.europa.eu/legal-content/EN/TXT/?uri=CELEX%3A32023R1029
[9] Macar, O., Kalefetoğlu Macar, T., Çavuşoğlu, K. et al. Risk assessment of oxidative stress and multiple toxicity induced by Etoxazole. Sci Rep 12, 20453 (2022). https://doi.org/10.1038/s41598-022-24966-0
[10] https://www.usahops.org/growers/plant-protection.html
[11] https://www.ihgc.org/wp-content/uploads/IHGC_Statement_DG-SANTE_Bifenazate-MRL_2024.pdf
[12] https://www.fda.gov/regulatory-information/search-fda-guidance-documents/guidance-industry-channels-trade-policy-commodities-residues-pesticide-chemicals-which-tolerances
[13] https://docs.wto.org/dol2fe/Pages/SS/directdoc.aspx?filename=q:/G/SPS/GEN1944.pdf&Open=True
[14] https://eping.wto.org/en/TradeConcerns/details?imsId=448&domainId=SPS
[15] https://food.ec.europa.eu/horizontal-topics/farm-fork-strategy_en
[16] https://www.euspa.europa.eu/newsroom/news/can-we-halve-use-pesticides-eu-2030
[17] https://www.bbc.com/news/world-europe-68218907
[18] https://www.lemonde.fr/en/international/article/2024/03/15/european-commission-rolls-back-cap-s-green-measures_6621907_4.html
[19] https://www.usahops.org/growers/plant-protection.html
[20] According to USHIPPC, The UK, Hong Kong, China, Japan, Taiwan, Turkey and Vietnam all have 15ppm as their acceptable MRL. The U.S., Australia and Canada all have a 7ppm MRL.
[21] https://www.just-drinks.com/news/beer-consumption-sluggish-in-eu-amid-macroeconomic-scars/
[22] https://www.statista.com/statistics/270275/worldwide-beer-production/
[23] https://www.ihgc.org/wp-content/uploads/IHGC_Statement_DG-SANTE_Bifenazate-MRL_2024.pdf
[24]https://www.nass.usda.gov/Statistics_by_State/Regional_Office/Northwest/includes/Publications/Hops/2024/hops0324.pdf
[25] To my knowledge, this is the first time the term hop velocity and this trend has been reported in writing. I considered publishing a journal article on the subject, as I believe it is worthy. Unfortunately, I don’t have the time. If somebody would like to publish such an article based on my research, I would be happy to participate as a co-author.
[26] https://www.hoptalk.live/post/too-many-hops-10000-acre-cut-needed-says-barth
[27] https://brewingindustryguide.com/rightsizing-the-hop-market/
[28] https://www.nass.usda.gov/Statistics_by_State/Washington/Publications/Historic_Data/index.php#hops
[29] https://www.usahops.org/img/blog_pdf/474.pdf
[30] https://www.usahops.org/img/blog_pdf/474.pdf
[31] https://www.yakimachief.com/commercial/press-room/european-fulfillment-center-belgium
[32] https://www.tranpak.com/faq/standard-pallet-size-dimensions/
[33]https://www.nass.usda.gov/Statistics_by_State/Regional_Office/Northwest/includes/Publications/Hops/2024/hops0324.pdf
[34] https://www.bloomberg.com/news/features/2024-02-10/why-germany-s-days-as-an-industrial-superpower-are-coming-to-an-end?embedded-checkout=true
[35] https://www.sba.gov/funding-programs/loans/covid-19-relief-options/paycheck-protection-program
[36] https://home.treasury.gov/policy-issues/coronavirus/assistance-for-small-businesses/paycheck-protection-program#:~:text=The%20Paycheck%20Protection%20Program%20is,off%2C%20and%20cover%20applicable%20overhead.
[37] https://projects.propublica.org/coronavirus/bailouts/
[38] https://www.ncbi.nlm.nih.gov/pmc/articles/PMC9874718/
[39] https://www.washingtonpost.com/business/2020/12/01/ppp-sba-data/
[40] https://home.treasury.gov/policy-issues/coronavirus/assistance-for-small-businesses/paycheck-protection-program
[41] https://www.stlouisfed.org/publications/regional-economist/2022/jul/was-paycheck-protection-program-effective
[42] https://europa.eu/newsroom/ecpc-failover/pdf/speech-24-1484_en.pdf
[43] https://economy-finance.ec.europa.eu/eueconomyexplained/recovery-and-resilience-facility_en
[44] https://ec.europa.eu/commission/presscorner/detail/en/statement_24_971
[45] https://www.politico.eu/article/eu-countries-economy-spending-rules-budget-pandemic-funds/
[46] https://cepr.org/voxeu/columns/eu-economy-after-covid-19-implications-economic-governance
[47] https://commission.europa.eu/news/recovery-funds-continue-drive-positive-change-and-support-eu-economy-2024-02-21_en
[48] https://www.rferl.org/a/ukraine-eu-refugees-fatigue/32730367.html
[49] https://ec.europa.eu/eurostat/statistics-explained/index.php?title=Inflation_in_the_euro_area
[50] https://www.europarl.europa.eu/thinktank/es/document/EPRS_BRI(2024)757783
[51] https://eu-solidarity-ukraine.ec.europa.eu/eu-sanctions-against-russia-following-invasion-ukraine_en
[52] https://www.euractiv.com/section/agriculture-food/news/eu-measures-to-tackle-surge-in-russian-grain-imports/
[53] https://www.euractiv.com/section/agriculture-food/news/eu-increasingly-food-dependent-on-russia-fertiliser-company-ceo-warns/
[54] According to the UNHCR page cited, Germany, Poland and the Czech Republic have accepted the largest numbers of Ukrainian refugees with 1,139,690, 956,635 and 589,285 refugees respectively.
[55] https://data.unhcr.org/en/situations/ukraine
[56] https://www.nytimes.com/2024/01/18/world/europe/german-economy-standstill.html
[57] https://www.telegraph.co.uk/world-news/2023/11/15/olaf-scholz-60bn-climate-budget-unconstitutional-green-blow/
[58] https://finance.yahoo.com/news/germany-likely-recession-amid-uncertainty-155522534.html
[59] https://apnews.com/article/germany-2024-budget-farmers-subsidies-protests-8e2e82a9ce37363df4473c22ed49ad6d
[60] https://www.reuters.com/world/biden-germanys-scholz-stress-unified-front-against-any-russian-aggression-toward-2022-02-07/
[61] https://www.aljazeera.com/news/2024/2/26/denmarks-nord-stream-probe-finds-sabotage-not-enough-grounds-for-case
[62] https://www.reuters.com/world/europe/sweden-wont-share-nord-stream-investigation-findings-with-russia-pm-2022-10-10/
[63] https://www.reuters.com/business/energy/us-lng-export-pause-leaves-eu-industry-odds-over-energy-security-2024-02-02/
[64] https://www.politico.com/news/2024/01/19/biden-europe-gas-exports-00136671#:~:text=The%20European%20Union%20has%20slashed,billion%20cubic%20meters%20in%202023.
[65] https://www.cnbc.com/2023/04/18/germany-shuts-down-last-nuclear-power-plants-some-scientists-aghast.html
[66] https://www.greenmatch.co.uk/blog/energy-prices-europe
[67] https://timesofindia.indiatimes.com/business/india-business/decoding-germanys-manufacturing-sector/articleshow/108106397.cms
[68] https://www.tyrepress.com/2024/02/high-costs-bureaucratic-hurdles-michelin-on-germany-factory-closures/
[69] https://apnews.com/article/france-eu-farmers-protest-prices-cdefc99be2ba62cabf8f85248f1a4c95
[70] https://finance.yahoo.com/news/gloom-settles-over-germanys-economy-112646727.html
[71] https://time.com/6957927/german-nationalism-afd/
[72] https://www.aljazeera.com/opinions/2024/2/12/the-eus-migration-policies-and-the-end-of-human-rights-in-europe
[73] https://www.theguardian.com/world/2023/sep/21/revealed-one-in-three-europeans-now-votes-anti-establishment


