


Author’s Note: If you haven’t yet read Part One of the 2025 State of the Hop Industry, the two can be read separately so enjoy this one and read the other when you can.
.
PROFIT & LOSS
The data show the profitable years for the U.S. hop industry since 2012 were 2008 and 2009. The reason for that is the cost of production survey the industry publishes. In my October 2022 article entitled, “How much do U.S. Hops Really Cost?” I explain how the industry changed the Washington State University (WSU) Cost of Production Survey in response to canceled brewers’ contracts in 2009. While brewers did cancel their contracts en masse in 2009, the hop industry never returned to the pre-2010 method for calculating the cost of hop production. Craft brewers paid the price.
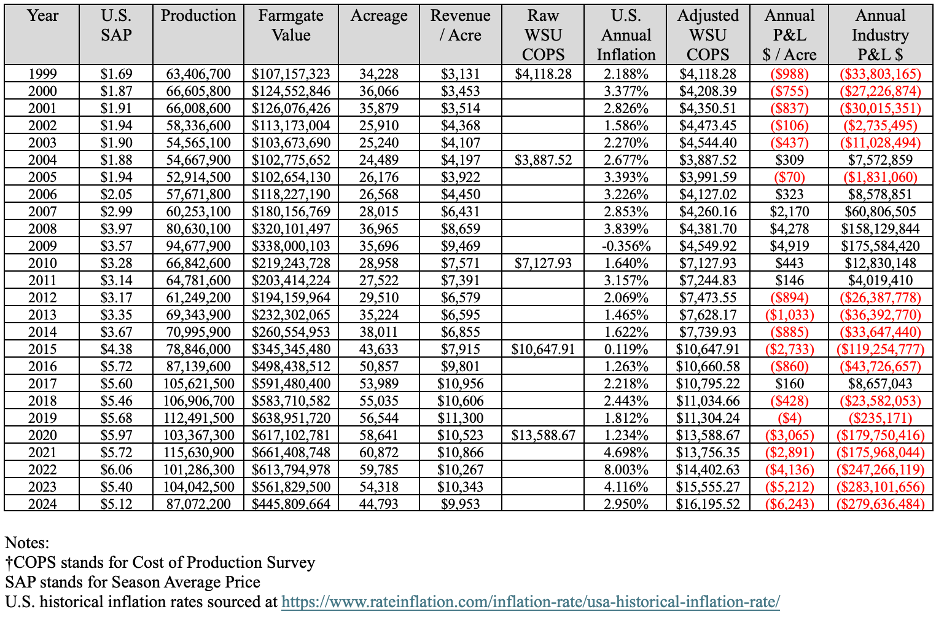
The doubling of acreage between 2012 and 2021 suggests American farmers had some financial incentive to produce hops. If we are to believe the cost of production data, between 2012 and 2024 the U.S. industry had one profitable year in which the entire industry made a profit of $8.65 million. The industry claims, however, to have lost $1.44 BILLION since 2012 (Table 22). Something is not right. Maintaining these claims and not returning to a more accurate method for reporting the cost of production demonstrates arrogance and a blatant contempt for brewers.
Table 22. U.S. Hop Industry Profit & Loss (P&L) Analysis
I mention this because if the industry continues to publish the survey every five years, WSU will publish a new survey this year. So, now is the time brewers could ask questions about how it is calculated. The survey wasn’t always the way it is today. Massive changes in the way the cost of production was calculated happened in 2010[1]. The 2010 report explains the methods they used to generate inflated prices. Nobody read the fine print. You can download it for free here if you’re interested.
If the industry continues to follow the pattern since 2010, they will need to claim the cost of production per acre has increased to over $19,000 per acre in 2025. I believe this is the year the survey breaks down. Decreasing the cost of production is unthinkable in the current economy. That would expose the manipulation from the previous 15 years and brewers would lose trust in the industry. Increasing the reported cost of production while farmers continue to produce at lower prices would create a dichotomy that cannot be explained. Reported losses more ridiculous than the $1.44 billion dollars “lost” since 2012 would seem disingenuous. I think the industry may have backed itself into a corner with the WSU survey. I suspect the cost of production survey, which has existed for decades will be discontinued. If it continues, I look forward to reading the results.
Most craft brewers with whom I have spoken over the years want to support the farmers from whom they purchase their hops. It is common for industry supported studies to produce bias results favorable to the sponsoring industry[2][3]. Data used to calculate costs should not come from the people with a financial interest in the results. In the case of the cost of hop production survey, a higher cost number anchors price negotiations at a higher level. Hop farmers are smart. They know this.
The period between 2000 and 2004 was considered by hop farmers to be one of the most difficult in history. According to industry data, those look like good times. It’s a miracle any farmers survived the massive losses brought by the high prices paid during the craft boom years (Figure 11).
Figure 11. U.S. Hop Industry Annual Profit & Loss (P&L)

Source: USDA NASS, WSU Cost of Production Survey data

THE SURPLUS RESPONSE
We have seen the Delayed Surplus Response (DSR) play out in real time over the past five years. The DSR, as the name suggests, is responsible for surplus production continuing beyond the point when a known surplus exists. This prolongs and exaggerates the surplus and creates more dire consequences during the correction period. The DSR occurs for several reasons.
GREED: Long-term contracts lock in brewers to a supplier and limit their options when demand changes. The forced fulfillment of unnecessary contracts at premium prices during a surplus extends sub-optimal farmer pricing. While they appear to transfer the burden of oversupply to the brewery, they prolong the most painful part of the hop cycle (i.e., the surplus) for short-term gain.
EMOTION: The largest hop merchant companies have hop farms or are owned by farmers. Farmers often hope that next year will be better when there is a problem. Many are slow to realize when they are deep in a crisis that won’t be resolved in a year. No farmer wants to decrease their farm efficiency by producing below capacity. Ego combined with concern about legacy and gossip make them subject to several cognitive biases[4].
TRADITION: Nobody in the hop industry knows the demand for hops. This could be solved, but doing so would disrupt the current narrative. Merchant/farmers have convinced brewers that an inefficient contracting system is the only way to know demand and secure hops for the future. The real purpose of the contract, however, is to secure financing for production. Aiming at the wrong target has led to a lot of missed shots. The current antiquated contract system is not an accurate forecaster of demand.

YOU ARE HERE!
In my February 2023 article entitled “The Truth Behind the Hop Surplus” I introduced a graph that demonstrated the hop cycle in linear terms (Figure 12). In 2023, production decreased, but annual production was still adding to the cumulative surplus.
Figure 12. Estimated location in the hop cycle in 2022.

Almost two years later, the situation has changed in several important ways. Declining beer production, brewer owned surplus hops and failing breweries create a decreasing demand for hops (Figure 13). Deeper cuts will be required to bring the industry within the target zone where a potential crop failure can interrupt the consistency of supply for a major brewery somewhere on the planet. The goal is not balance. It is to maintain consistency of supply while also maintaining the threat of an interruption. That is the sweet spot.
During the past two years, the American hop industry stopped adding to their surplus. As a result, the red dot marking the current location has moved further to the right than it was in February 2023, but not by much.
Figure 13. Estimated location in the hop cycle in 2025.

Source: The MacKinnon Report
The next cuts will determine the rate at which that red dot continues to move to the right (i.e., how quickly the industry reduces the surplus). Previous efforts in the U.S. will yield their first results in 2025 in the form of stock decreases. That should provide some optimism in the March and September stock reports. If there is no sign of relief in those reports it will mean that demand has fallen much further than anticipated.
Europe is in a very difficult inventory situation due to the global decline in beer production. Data is not as available as in the U.S. Sources have shared with me that inventories of noble European varieties have built up in warehouses. The brewers to which these hops belong intend to use them, but working through them will take time. In the meantime, this creates reduced demand for several key European varieties between now and 2029. If acreage is not removed from production in 2025, Europeans will be taking a page from the American DSR playbook by adding to and prolonging their surplus. The problem for European farmers to idle or remove acreage is that they need two or three years to reach harvest once the hops are necessary again. This makes it a difficult and expensive proposition.
If you’ve made it this far, I assume you’re finding this article useful … or at least entertaining. The number of subscribers has skyrocketed over the past 6 months. I would like to thank those of you who read and share my articles. That is the biggest compliment you could give, and I appreciate that you do that. I would like to ask you to do that now if you know somebody who might enjoy reading nerdy articles about hoponomics.
If you’re a brewer there’s another way you can support my writing and take advantage of the things I’ve learned over the past 25 years. I’m offering my hoponomics expertise to help a limited number of breweries learn how to hack their hop buying tactics. If you want to learn more about how that works, click the link below. I hope to hear from you!
HOP STOCKS
The stocks data reported by the USDA lack context. Data without context is difficult to interpret. Separating out to whom the inventory is assigned begins to tell a story. There was a clear inflection point with regards to inventory in 2014 (Figure 14). For a decade the problem has been building.
Figure 14. September 1 Hop Stocks Separated by Brewer and Merchant/Farmer
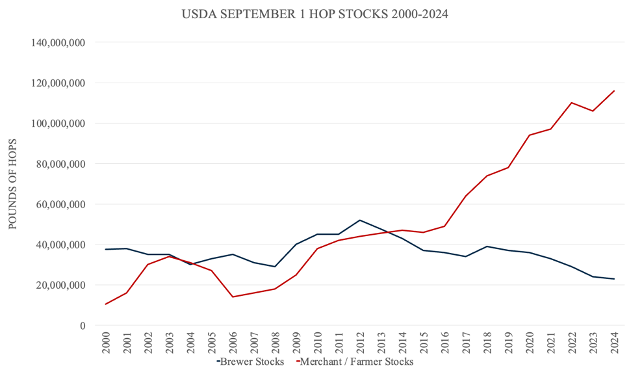
Source: USDA Hop Stocks Reports 2000-2024
For a deeper analysis of the September 1 Hop Stocks report, please read my September 2024 article entitled, “Trends Uncovered in the Hop Stocks Report”.
Looking back at the past 25 years of September 1 hop stocks relative to U.S. production represents the hop cycle in a linear form. Surges in production result in surges in inventory that take years to correct. In 2025, it is clear the industry is oversupplied and that it will be some time before some sort of equilibrium is reached again (Figure 15).
Figure 15. Hop Stocks vs. Production from same year 2000-2024

SOURCE: USDA NASS
DEPLETION
It is reasonable to assume nobody incurs the expense of shipping without good reason. Hop movement out of storage (i.e., depletion) is, therefore, a signal of real or anticipated demand. That makes it valuable data. Depletion without meaningful context, however, is still not very useful (Figure 16).
Figure 16. U.S. Annual hop stocks depletion 2014-2024[5]

Source: USDA Hop Stocks Reports 2014-2024
Depletion is a lagging indicator[6]. Since production and acreage do not often fluctuate so fast from one year to the next, it can be used to forecast. With the proper context, we can interpret meaning from the depletion figure. Between 2012 and 2021, as the size of the market and the crop increased, depletion increased … as you would expect[7]. Measuring the annual depletion between September year n-1 and year n as a percentage of total available inventory (i.e., September stocks year n-1 + crop year n-1) reveals surpluses and deficits (Figure 17).
Figure 17. Depletion % relative to total hops available 2000-2024

SOURCE: USDA NASS
Other things can create misleading data spikes. For example, when Yakima Chief Hops™ built their storage facility in Belgium in 2021, which according to their website holds 8,800 pallets of hops, it is reasonable to assume they filled it with hops they anticipated would be delivered within the region[8].
Another example of a spike are the stricter pesticide regulations in the EU. The affected hops are salvageable since the rest of the world has not implemented a similar ban, but they had to be replaced with similar product. The offending product had to be moved out of the EU. If you’d like to read more about that situation, please see my March 2024 article entitled, “Pesticides, Hop Stocks and Germany’s Growing Problem”.
FUN FACT: Sometimes hops seem to disappear. Perhaps that’s why Hop Growers of America refers to depletion as “disappearance”. When I started working as director of Hop Growers of America, the board of directors told me about “the balancing item”. It was a catch-all line item used to account for the discrepancy between hops produced and hops available during the days of the third Federal Marketing Order. With multiple years of aging inventory in different forms in warehouses belonging to merchants that refuse to cooperate, it seems tracking inventory was difficult. More on the possible source of the balancing item discrepancy below.
WHOSE HOPS?
This hop surplus is complicated. It is more contracted than previous cycles and the decline in global beer production complicates the situation. Breweries that have not worked through their personal surplus don’t want to sell them at a loss because market prices are much lower today. Instead, the hops wait to be used, or the brewer hopes to sell them.
On January 20, 2025, the following inventories were available on Lupulin Exchange[9]:
Crop years 2017 and 2018: 5,874 pounds (2,665 kg.)
Crop year 2019: 32,491 pounds (14.7 mt.)
Crop year 2020: 111,461 pounds (50.5 mt.)
Crop year 2021: 127,094 pounds (57.6 mt.)
Crop year 2022: 210,070 pounds (95.2 mt.)
Crop year 2023: 147,447 pounds (66.9 mt.)
Crop year 2024: 76,399 pounds (34.6 mt.)
That’s over 700,000 pounds (318 mt) of hops! The Lupulin Exchange is one outlet for the resale of aging inventory. According to the US Hop Source web site, they have access to 4.85 million pounds (2200 mt) of hops available for sale. If that number is correct, I suspect some of the hops listed on the Lupulin Exchange are also available through U.S. Hop Source.
Although these stocks are contracted and sitting in warehouses ready to ship, most breweries have not paid for them. I mention this to highlight a gray area. Merchants and farmers refer to these as “the brewers’ hops”. Bankers like that. It sounds like the deal is already done and the money is on its way. I learned over the years that until the money is in the bank those hops are not sold.
Whose hops are they? On paper, they belong to the brewer. Brewers don’t always agree[10]. The merchant, however, pays to insure those hops because they’re in his warehouse. If that warehouse burns down, the merchant replaces the hops[11]. Quite a few bank employees read these articles. If you work at a bank and you’d like to know the questions to ask about aging hop inventory, feel free to contact me. You can reach me through my website or on LinkedIn.
TRADE BALANCE
Over the years, I discovered there are problems with the way the U.S. hop industry reports export-import information. This will be a good topic for a separate article as it requires a deeper dive than I am prepared to do as part of this article. It’s important though because it deals with transparency. There is a point at which information too will become proprietary.
CONCLUSION
For the 25 years I’ve been working with hops, every year merchants and farmers have said, “it’s going to be an interesting year”. I’m sure there are plenty of people saying that this week in San Diego. There is never a dull moment in the hop industry. The next several years will be more significant than any other similar period in hop history. If the popularity of public varieties continues to decrease, it will mark the end of an era. If you’re a brewer, you might not think that matters much so long as you can get the three or four proprietary varieties you want from your favorite merchant. This sort of situation is new to the hop industry, but it has happened plenty of times in other industries. The result of high market concentration is higher prices, less selection and more onerous terms and conditions of sale.
I don’t think most brewers care what they will lose. They’re concerned more about getting the popular hops they want when they need them. I think that’s more because they’re busy and going in too many directions. They don’t have time to worry about a hop cartel they may not understand. There aren’t enough hours in the day for that. By the time they figure out what they have traded away, it will be too late to get it back. I’ve referred to the story of Dr. Faustus in two previous articles where I discuss this in greater detail. If you don’t know the origin of the term “Faustian bargain”, I’ll include a fun video summary of the story at the end of this article.
For those who care and want to try to make a difference in your own way, let’s explore how we can work together. Click the link below to find out more.

FORECAST
Farmers in 2025 want to produce any varieties needed to avoid acreage reduction. That combined with the surplus means it is a buyer’s market for hops new and old. There will be opportunities between now and April for breweries who know how to exploit them. Other opportunities to secure low prices will come along later, in the summer months. The overall expectation, however, is for lower pricing in 2025. There is no chance of a shortage on the horizon.
Acreage should decline in the EU and in the U.S. If farmers don’t reduce acreage, 2026 and 2027 may also be very “interesting”.
I expect the market to continue to be segmented with fresh proprietary varieties commanding a premium price due to their limited access. The coming year represents an opportunity for brewers to evaluate the value of proprietary varieties relative to their premium price. They might want to weigh if they are OK with a more monopolistic hop industry in which each vendor is selling their own brand. In that world, you’ll look far and wide to find a bargain, prices will all be high due to tacit collusion. Those are the consequences of increased market concentration. The path to high market concentration is increasing proprietary variety popularity. Brewers should look for ways to minimize their reliance on and exposure to proprietary varieties while still reaping the benefits from them. There are some creative ways to do that.
[1] 2010 WSU Cost of Hop Production Survey available at: https://pubs.extension.wsu.edu/2010-estimated-cost-of-producing-hops-in-the-yakima-valley-washington-state
[2] https://jamanetwork.com/journals/jama/fullarticle/196846
[3] https://pmc.ncbi.nlm.nih.gov/articles/PMC6187765/
[4] https://www.verywellmind.com/cognitive-biases-distort-thinking-2794763
[5] If you’ve been reading these articles for a while, this graph may look familiar. I used it back in September 2024. Since then, there have been nearly 100 new subscribers, so I include it for their benefit and to refresh everybody’s memory.
[6] https://www.investopedia.com/terms/l/laggingindicator.asp
[7] For the past several years, Hop Growers of America refers to the amount of inventory drawn down over the course of the year, as revealed by the USDA Hop Stocks reports, as “disappearance”. I prefer “depletion” since it sounds like an intentional act.
[8] https://www.yakimachief.com/commercial/press-room/european-fulfillment-center-belgium
[9] It is interesting to note that you must now login to see pricing on the lupulin exchange.
[10] Smaller brewers might even abandon a contract with a smaller merchant because they feel the risk is worth the reward. I am speaking about my firsthand experiences with brewers who did exactly that and moved on to purchase the same hops from another supplier at a lower price.
[11] There are exceptions of course, for example if the brewery has paid for the hops and they are just using the storage space available with the merchant. In that case, it would be normal for the brewery to ensure their hops since they have a financial liability if they are destroyed.
[12] I have cut several sections I planned to write about to keep this article shorter (I know that probably sounds like a joke). I’ll return to the topics I skipped in future articles.