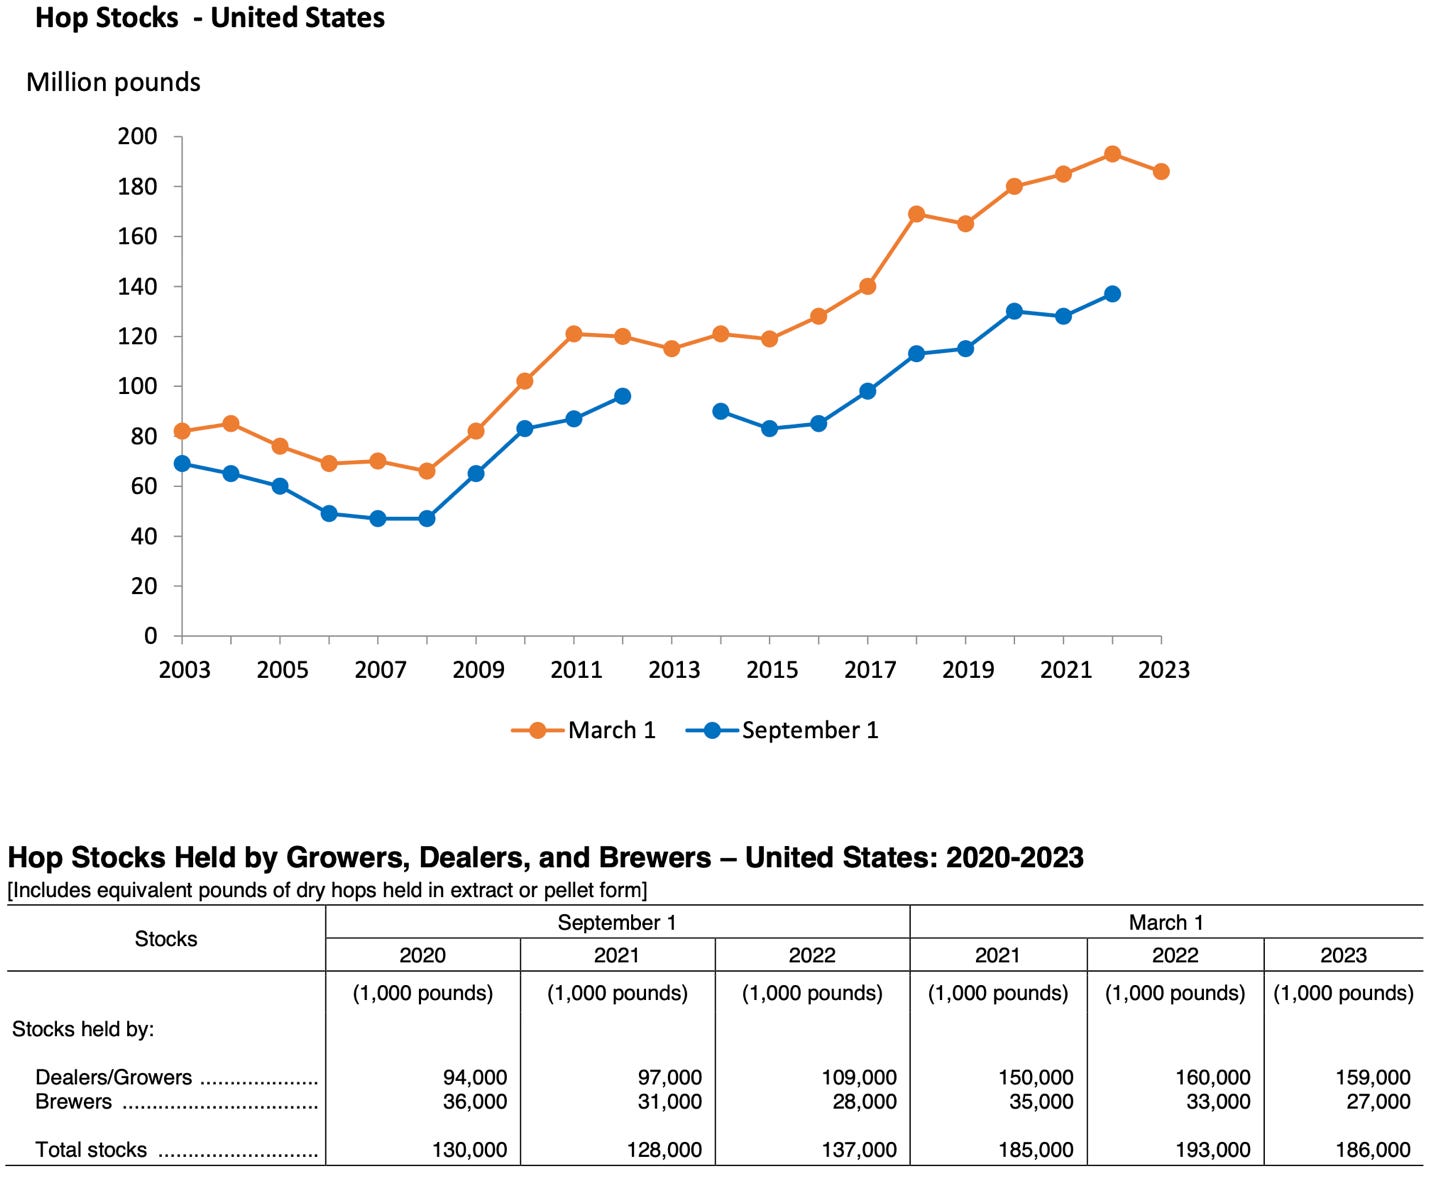
On March 17th, the USDA issued its March 1 hop stocks report for 2023[1]. You can download it for yourself from the USDA website. The graph the USDA includes in their report records the changes from year to year for March and September hop stocks report (Figure 1).
Figure 1. U.S. March 1 Hop Stocks Report.
Source: USDA NASS
If that graph means very little to you, I know how you feel. In my opinion, it is not the best way to use the available data to convey the inventory situation. The data behind the graph is useful. It paints a picture of the direction the industry is headed when presented differently and over a longer period. You can read the entire report for yourself to get the summary of the data they offer.
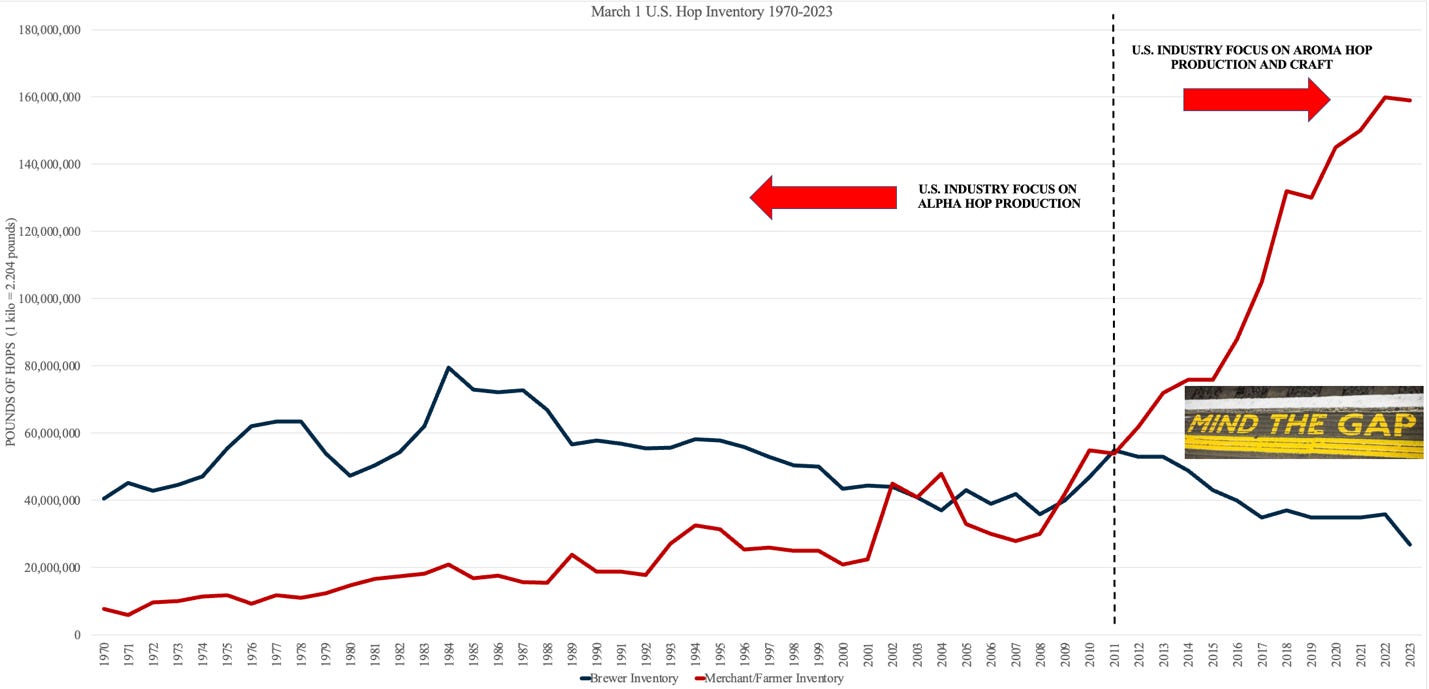
Let’s focus on March 1 data. If we separate brewer inventory data from merchant/farmer data, a clear picture emerges of the change in the ownership of inventory since 2012 (Figure 2)[2].
Figure 2. USDA March 1 Hop Stocks Data 1970-2023
Source: USDA NASS 2023 March 1 Hop Stocks Report 1970-2023
Since 2011, merchant/farmer inventory tripled in size. Brewers cut their inventory in half. The total quantity of inventory in storage in the U.S. on March 1st increased from 109 million pounds in 2011 to 186 million in 2023. U.S. hop production during that time increased from 64.7 million pounds to 101.2 million pounds. If the current inventory trend was in line with historical data, possession would be more equally distributed. They are not. Something significant changed. Figure 2 demonstrates that merchant/farmers are held (i.e., own) 85.48% of total U.S. inventory in 2022.
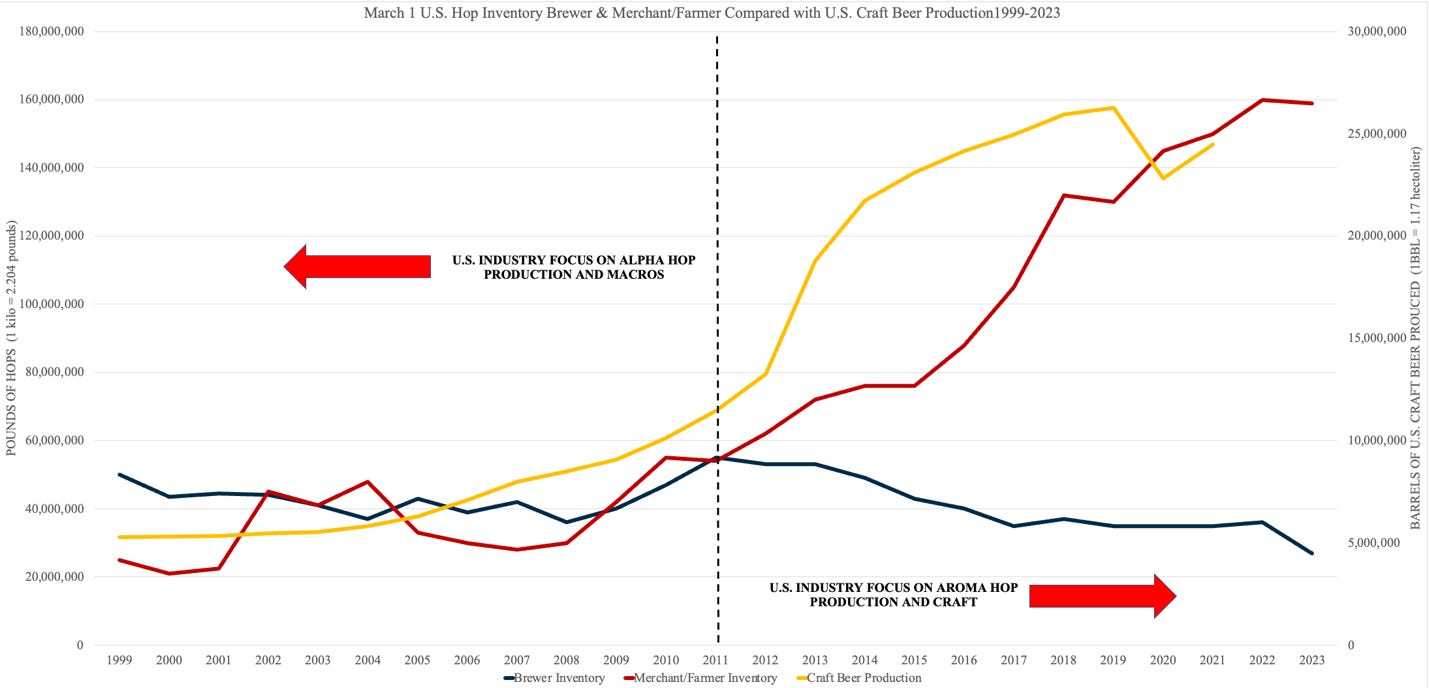
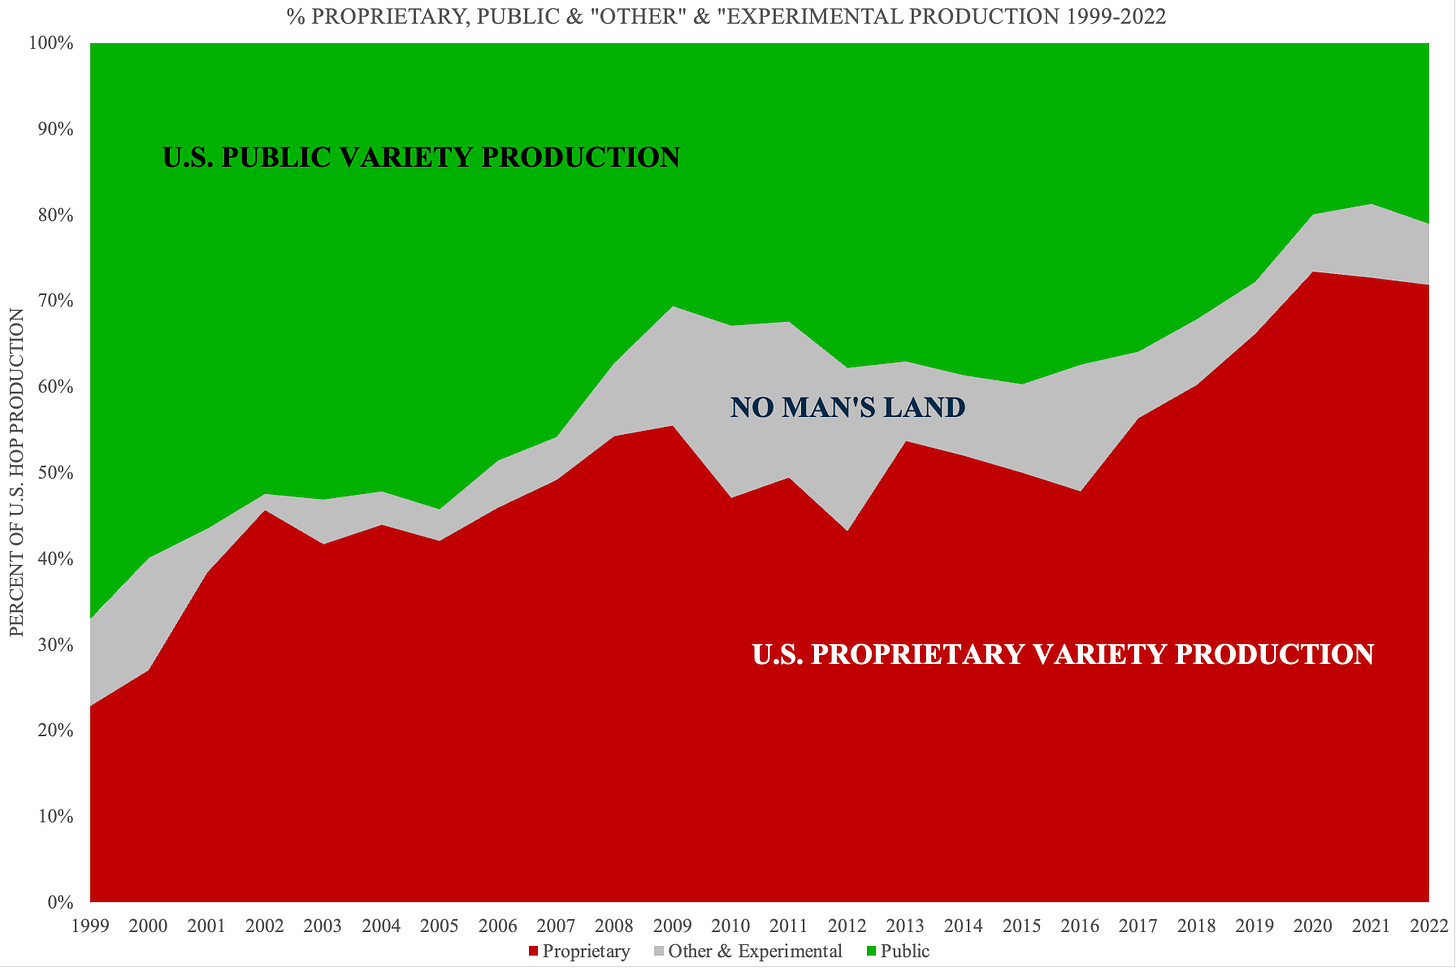
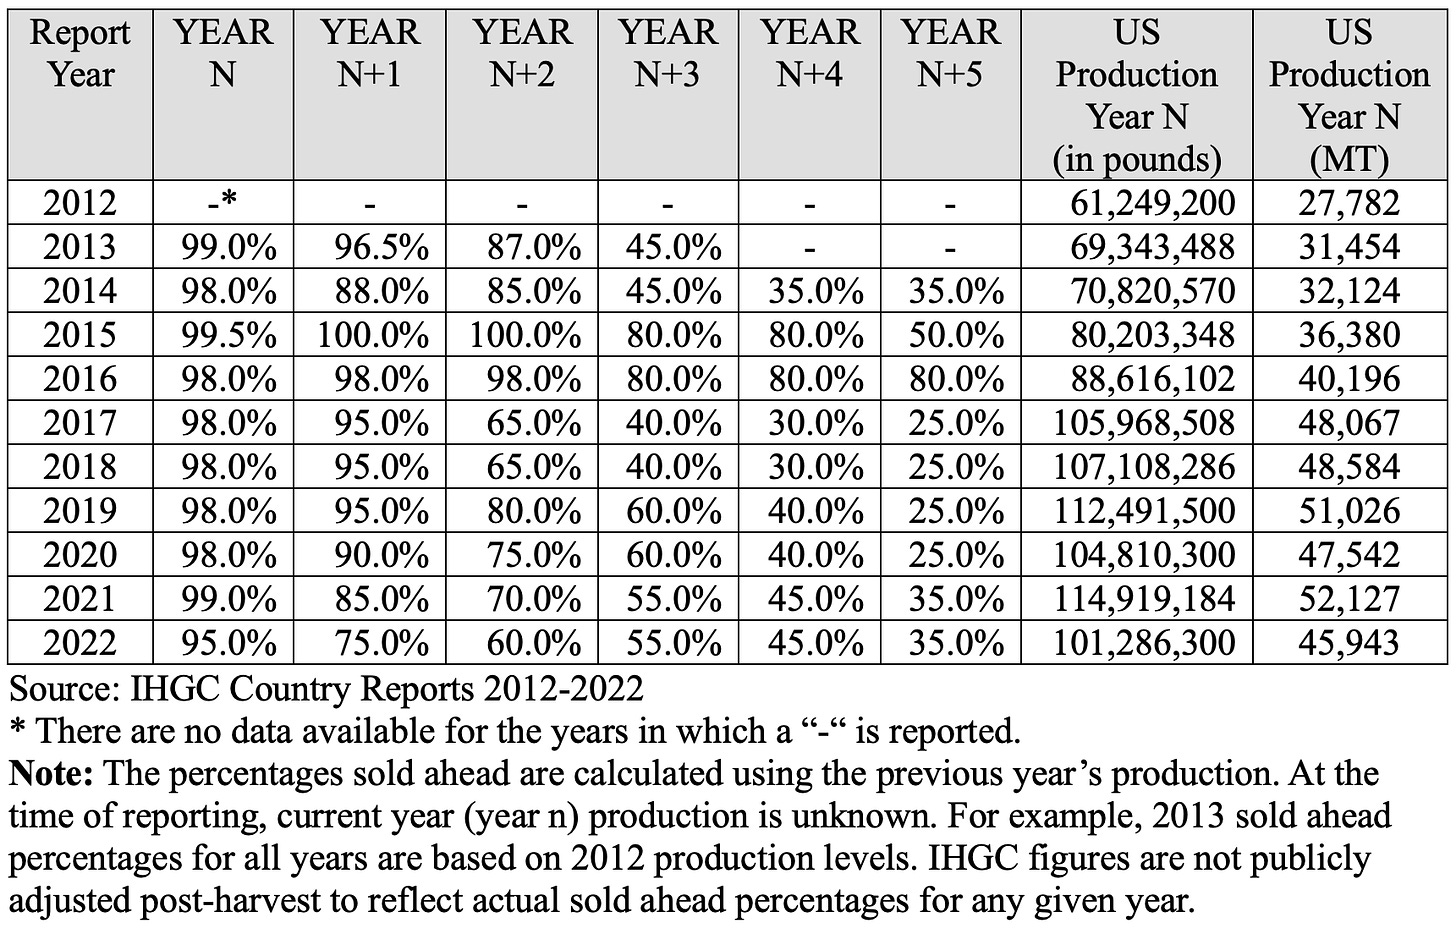
If we zoom into data available since 1999, it is obvious that merchant/farmer held inventory increased together with increases in craft beer production (Figure 3). Increases in the proportion of proprietary varieties produced in the U.S. (Figure 4) and the amount of that crop that was contracted (Figure 5) changed during this same period.
Figure 3. USDA March 1 Hop Stocks Data 1999-2023
Source: USDA NASS 2023 March 1 Hop Stocks Report 1999-2023, Brewers Association
Figure 4. Proprietary and Public Variety Production the U.S. 1999-2022
Source: USDA National Hop Reports 1999-2022
Are the things you’re reading here different from the hop industry information you’re used to seeing? If you find that interesting, I would like to ask you to please return some value for the value you have received in the spirit of value-for-value[3]. I don’t want money for these articles. I believe they contain important information every brewer should know. Charging money for them would only slow their spread. For me, it would be valuable if you could share this article with anybody who might find it worth reading. I am humbled by the many subscribers who have pledged money to share with me what they think these articles are worth. Thank you very much for that. I am grateful for the gesture, but I will not charge for my biweekly articles. Also … I promise they will become shorter and less time consuming in a few months. If you’ve not already subscribed, please consider doing that now. And now … back to our regularly scheduled program.
HOT POTATO
A closer look into the data reveals that brewers in 2023 reduced their March 1 inventories by 9 million pounds (25%) relative to the previous year. Merchants/farmers, however, reduced their inventory by a mere one million pounds (0.63%) relative to the previous year. During a surplus breweries can switch to a version of just-in-time inventory to create significant savings with their contracted inventory. In 2023, there is no threat of a shortage of American hop varieties for the foreseeable future. There will be warning signs before breweries must be concerned about supply issues.
The most recent time brewers relied on merchant/farmer storage was prior to the 2007-2008 deficit situation. Twenty years of surpluses increased their confidence that a secure supply of hops would always be available. That was true … until it wasn’t. If you’re a brewer and you’d like to know what signs to look for, you can message me on LinkedIn. I’ll be happy to share observations from my 23 years working with hops.
CONTRACTED NOT SOLD
The hop industry never adapted its forward contracting practices to meet the needs of craft breweries. It required craft breweries large and small to adapt to their business model. With producers of proprietary varieties holding their hops hostage, craft breweries had no alternative but to sign forward contracts.
“Every empire suffers from hubris, arrogance and condescension, and therefore a moral blindness.”
Cornel West
Forcing craft brewers into the forward contracting system resulted in the highest sustained sold ahead rates in the history of the International Hop Growers Convention (IHGC) (Figure 5). It also created an estimated 54-million-pound surplus of American hops[4].
Figure 5. IHGC Sold Ahead Data 2012-2022
Source: IHGC
CONTRACTED ≠ SOLD
With a surplus of tens of millions of pounds in storage today, brewers don’t need to lock themselves into a contract to buy hops. Sellers will argue that through contracting brewers can secure their supply going forward. You can kill a fly with a hammer, but it’s not the most appropriate tool. Locking small craft brewers into long-term fixed contracts are a hammer. Contracts represent recurring sales that serve the financial needs of the merchant/farmer. They have outstanding lines of credit without which they cannot survive. Those lines of credit are based in part on the book value of their forward contracts.
As a recovering merchant, I can tell you that every merchant/farmer needs to move their inventory and get paid as fast as possible. They perpetuate the myth that the hops belong to the companies to whom they are contracted. That ensures their lines of credit continue. Meanwhile, every merchant/farmer knows that “contracted” does not mean “sold”. Hops are sold when you receive money in your bank account from a buyer. At the 2023 Hop Growers Convention, this was acknowledged for the first time of which I am aware in a public forum.
“Hop contracts do not equate to hops sold or used. There are thousands of “sold” hops sitting in dealer and grower warehouses. Until those hops are shipped to a brewery and invoiced, that volume does not reflect current demand.”[5]
OVERSUPPLY
Where did all this inventory come from? It is convenient in 2023 to place the blame on the reduced demand for hops due to Covid. In a September 2020 Yakima Herald article, Yakima Chief Hops™ humblebragged about their foresight to reduce acreage because in February 2020 they already knew the pandemic would impact their customers’ demand[6].
“We felt that was the responsible decision for our growers and our breweries, …” “No one benefits if there are too many hops.”
- Bryan Pierce, Vice president of North American sales for Yakima Chief Hops (2020)[7]
In 2020, U.S. production declined by 9.1 million pounds. According to the 2022 Hop Growers of America statistical report, average 2020 yields decreased 10.6% to 1,770 pounds per acre from 1,981 pounds per acre in 2019[8][9]. According to USDA data, farmers in Washington, Oregon and Idaho increased acreage by 2,097 acres in 2020[10]. A deeper examination of the data reveals that proprietary varieties increased by 5,144 acres in 2020[11]. Citra®, HBC 394; Mosaic ®, HBC 438; Sabro™, HBC 438; and Pahto™, HBC 682 contributed 4,288 acres of that increase. Farmers reduced public variety acreage in 2020. That’s true. What nobody mentioned is that they planted even more proprietary acres.
“A lie that is half-truth is the darkest of all lies.”
- Alfred Lord Tennyson
In March 2021, Yakima Chief Hops™ claimed they set a new production record at “nearly 200,000 bales” (a figure that would equate to a 33.9% market share)[12][13]. The average bale weight in 2020 was 197 pounds[14]. If that figure is accurate, the company received approximately 39.4 million pounds in 2020. That’s close to the 40-million-pound figure Steve Carpenter (former CEO of the company) claimed the company handled the previous year[15]. It appears from these contrary reports that the company reduced very little, if any, acreage. There is no evidence if other merchant/farmers behaved in a similar fashion as online sources regarding their behavior was not available.
Why did the U.S. hop industry increase acreage in 2020 instead of reducing to reduce the burden for their brewer customers? Unless stated in a contract, a pandemic does not qualify as Force Majeure[16]. Brewers with contracts were bound to purchase the hops for which they contracted. The U.S. government designated farming and farmworkers as “essential” during the pandemic guaranteeing production[17][18]. Quite a few hop companies (farms and merchants) received Paycheck Protection Program (PPP) loans in 2020 and 2021. Many of those loans were forgiven[19]. This could be interpreted as Covid profiteering[20]. If you’d like to check out how much your favorite hop company received, you can enter their name in the search bar on this web site[21].
SUPPLY MYTHS
Contracts are sold as a way for brewers to guarantee supply. As you might expect, there is more to the story. During hop bull markets, merchants and farmers threaten to not supply hops without a contract[22]. During my previous life as a hop merchant, I demanded five-year contracts from brewers because farmers demanded them from me. No contract … no hops. Merchant/farmers used those contracts to lock in sales at high prices and prolong the bull market. I did the same thing when I was a merchant. It is very profitable for everybody involved. When viewed from a different perspective, however, contracts enable merchant/farmers to finance and expand production capacity beyond their means … based on anticipated future sales. In a bull market, such as in 2008, farmers demanded contracts for hops they did not have the capacity to produce. The same thing happened between 2012 and 2020. In a bear market, the system will be different. Merchant/farmers want to avoid returning to a bear market. I’ll discuss that more in a future article. Again … if you’re a brewer and that sounds interesting to you, feel free to contact me and we can discuss that.
CONCLUSION
Traditional hop contracts have not served the craft industry the way they have the macro industry in the past. The result was a mountain of unwanted aging proprietary varieties. Craft brewers have been locked into contracts they don’t need and some of which they didn’t want in the first place.
Figures 2 and 3 reveal that in 2012 merchant/farmer contracted inventory began to soar. During that time, the number of craft breweries in the U.S. soared form 2,616 in 2012 to over 9,500 in 2022[23][24]. Since 2013, proprietary varieties have comprised more than 50% of U.S. hop production[25]. Correlation is not causation. It seems reasonable to conclude that inexperienced craft breweries contracted proprietary hop varieties they thought they needed when confronted by a hop industry giving them no alternative.
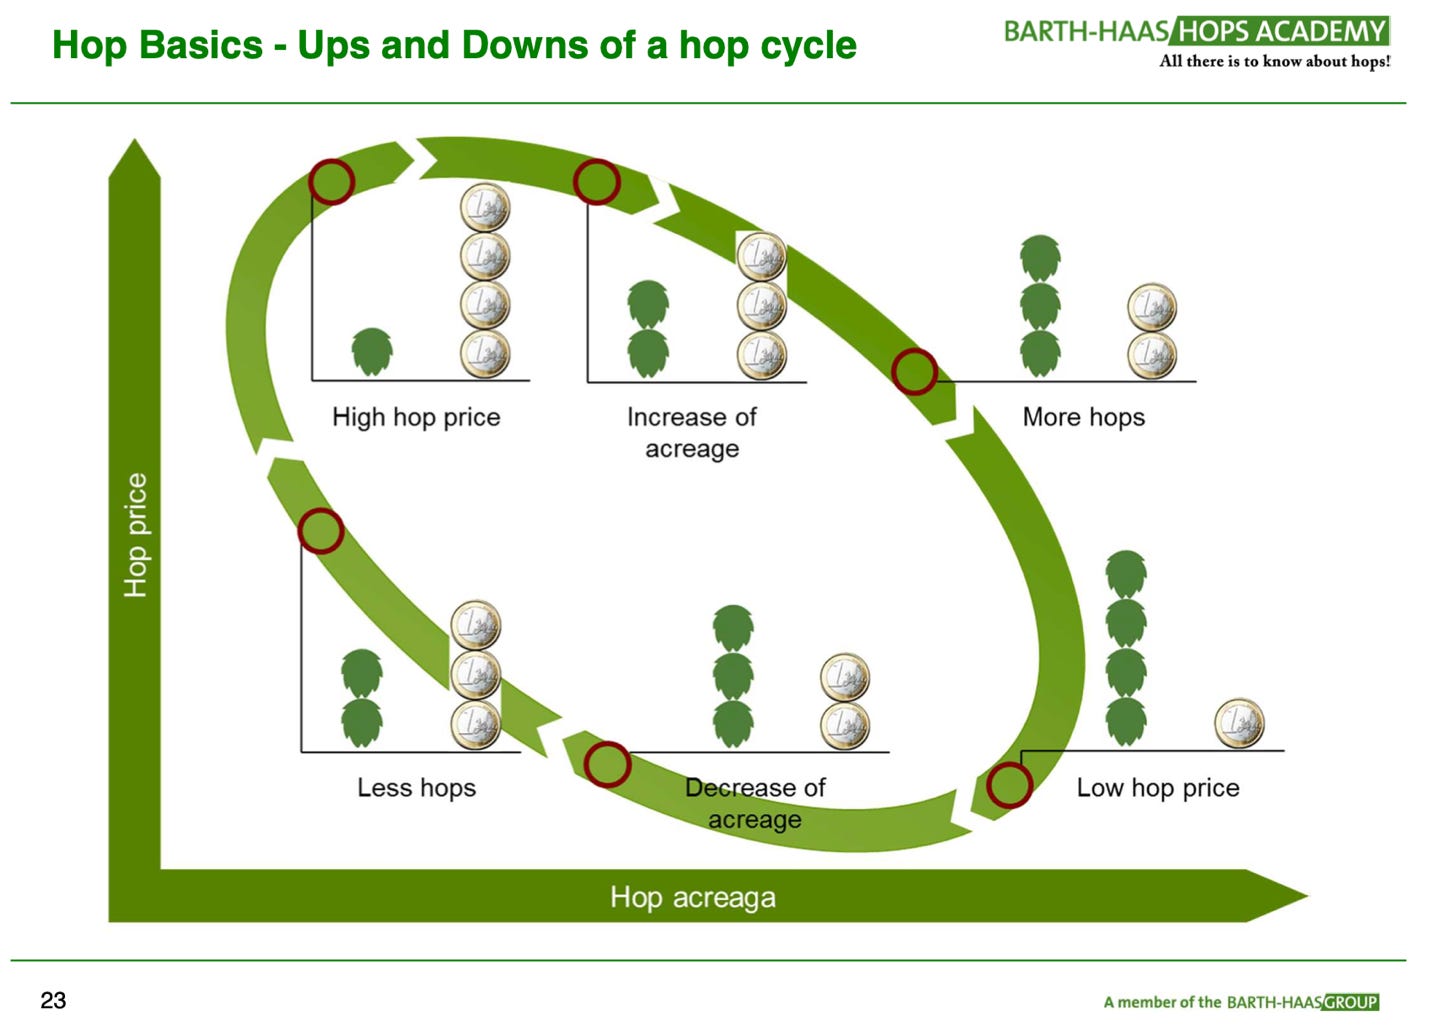
By 2021, public variety production in the Pacific Northwest plummeted to 18.67% of U.S. production. The increasing proportion of proprietary varieties in the U.S. created a powerful duopoly[26] reducing selection and competition across the industry[27]. Brewers buying proprietary varieties were price takers[28]. For decades, the hop industry suffered from boom-and-bust cycles. Many thought that the craft revolution brought an end to that. Some elements of the hop cycle appear to remain (Figure 6)[29][30].
Figure 6. Anatomy of the Hop Cycle
Source: Barth-Haas Hops Academy
Proprietary varieties were supposed to add a layer of control to prevent the cycle from recurring. They enabled a small group of merchant/farmers to influence supply and price. Greed, it seems, was the variable they could not control. If merchant/farmers plant public varieties in 2023, and if they are slow to remove enough proprietary varieties to clear the surplus, the current imbalance can depress inventory prices for a decade. I do not expect a price war for fresh proprietary crop. The crafty brewer will find great deals on the secondary market in the years to come. Brewers will find attractive bargains during the next five months. American warehouse space will be needed to accommodate the 100+ million pounds of bales that will be produced in 2023.
Someday, when the balance of power returns to the brewer, they would be wise to redefine the forward contracting system instead of shifting to spot market purchasing. There are equitable ways of forward contracting that have never been explored. There are ways to secure hop supply for brewers while giving farmers the guaranteed sales they want and bankers the collateral they need. I’ve discussed several of these ideas with people in the industry in recent years. The people with whom I spoke would change. Nobody is driving this discussion forward. So long as proprietary varieties give a handful of merchant/farmers the power to control supply and price, they alone will define the terms under which hops are sold.
[1]https://www.nass.usda.gov/Statistics_by_State/Regional_Office/Northwest/includes/Publications/Hops/2023/hops0323.pdf
[2] It is important to note that the U.S. hop stocks reports for March and September do not only represent American hops. They represent those hops reported as being stored in the U.S. at the time of the reporting. During my time in the industry, I have never taken the data presented as an exact representation of the hop stocks in storage at the time. Some companies participate in the survey. Others don’t. Some may lie. Others may miscount the inventory they have and report errors. It’s more difficult to count millions of pounds of hop products than you would imagine. Only the USDA knows who reports and who doesn’t report. I have always viewed the data with that in mind. For that reason, I do not recommend looking at the figures as if they were written in stone and sent down from the mountaintop. They are not precise. If we assume that the people who report, who don’t report and the ones who lie will remain consistent in their practice from year to year, the data create a picture over time of the general direction the industry is moving. That is good enough.
https://value4value.info
[5] https://www.hoptalk.live/post/too-many-hops-10000-acre-cut-needed-says-barth
[6] https://www.yakimaherald.com/news/local/hop-growers-make-changes-adjust-acreage-in-response-to-covid-19-pandemic/article_64c56709-9fca-513f-8b59-73095458b508.html
[7] https://www.yakimaherald.com/news/local/hop-growers-make-changes-adjust-acreage-in-response-to-covid-19-pandemic/article_64c56709-9fca-513f-8b59-73095458b508.html
[8] https://www.usahops.org/img/blog_pdf/435.pdf
[9]https://www.nass.usda.gov/Statistics_by_State/Regional_Office/Northwest/includes/Publications/Hops/2021/hops1221.pdf
[10] https://www.usahops.org/img/blog_pdf/435.pdf
[11]https://www.nass.usda.gov/Statistics_by_State/Regional_Office/Northwest/includes/Publications/Hops/2021/hops1221.pdf
[12] https://www.yakimachief.com/commercial/hop-wire/2020-crop-production-complete
[13] https://www.usahops.org/img/blog_pdf/405.pdf
[14] https://www.usahops.org/img/blog_pdf/405.pdf
[15] https://www.forbes.com/sites/kennygould/2019/10/25/learn-about-hops-with-steve-carpenter-5th-generation-farmer-and-former-yakima-chief-hops-ceo/?sh=538b572773cb
[16] https://www.americanbar.org/groups/government_public/publications/pass-it-on/spring-2022/spring22-franklin-wind-forcemajeure/
[17] https://www.npr.org/sections/thesalt/2020/03/27/821449729/essential-status-means-jobs-for-farmworkers-but-greater-virus-risk
[18]https://www.governor.wa.gov/sites/default/files/WA%20Essential%20Critical%20Infrastructure%20Workers%20%28Final%29.pdf
[19] https://projects.propublica.org/coronavirus/bailouts/search?q=yakima&v=3
[20] https://www.theguardian.com/uk-news/2021/dec/05/wall-of-secrecy-in-pfizer-contracts-as-company-accused-of-profiteering
[21] A company listed on this website can petition to have their name removed so it is not possible to find out how much PPP money they received. I downloaded the data in early 2022 for posterity.
[22] There are no documented cases of this of which I am aware. I therefore draw upon first-hand experience I gained as a hop dealer for over a decade.
[23] https://www.brewersassociation.org/statistics-and-data/national-beer-stats/
[24] http://washingtonbeerblog.com/brewers-association-releases-the-year-in-beer-report-for-2022/
[25] These calculations do not include “other” or “experimental” variety production, which was 9.30% in 2013 according to the 2013 USDA National Hop Report.
[27] MacKinnon, D.; Pavlovicˇ, M. Proprietary Varieties’ Influence on Economics and Competitiveness in Land Use within the Hop Industry. Land2023,12,598.
[29] https://esa.ipb.pt/lupulocerveja2019/img/S1A1.pdf
[30] https://brewingindustryguide.com/rightsizing-the-hop-market/

